
Figure 3.
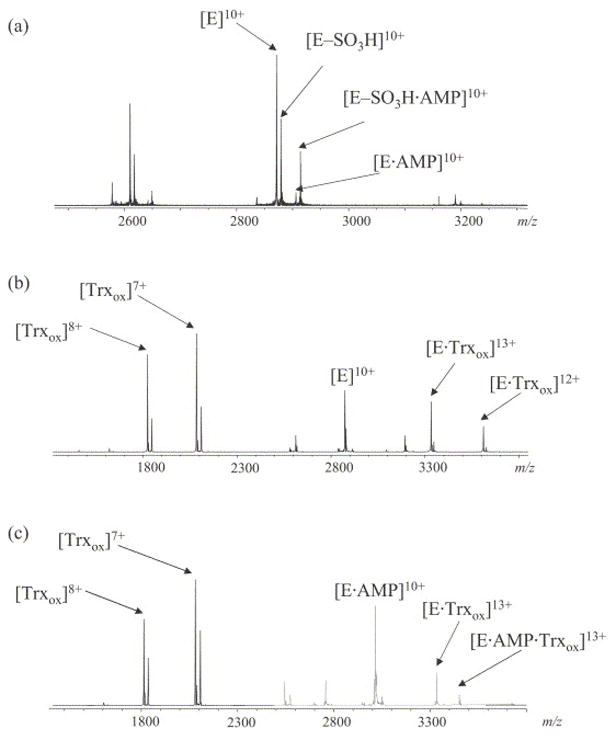
ESI mass spectra of 10 μM APS reductase with different ligands (A) APS reductase with 5 μM APS. Ions corresponding to various charge states of intact enzyme (E), thiosulfate intermediate (E–SO3H), noncovalent complex of enzyme with AMP (E·AMP) and noncovalent complex of intermediate with AMP (E–SO3H·AMP) are labeled. (B) APS reductase with 2.5 μM Trx showing the formation of a binary complex. (C) APS reductase with 2.5 μM Trx and 20 μM AMP showing the formation of a ternary complex.