
Figure 12.
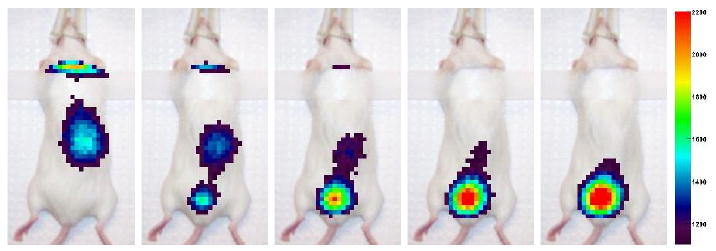
Five consecutive frames from the second MAG-3 mouse scan, obtained by a procedure identical to figure 10. Each frame across the figure is 150 s of data (2 × 10⁶ events). The total collected data for the whole scan (not all shown) was 22 × 106 events. The scan was performed with injected activity of 0.75 μCi of 99mTc MAG-3.