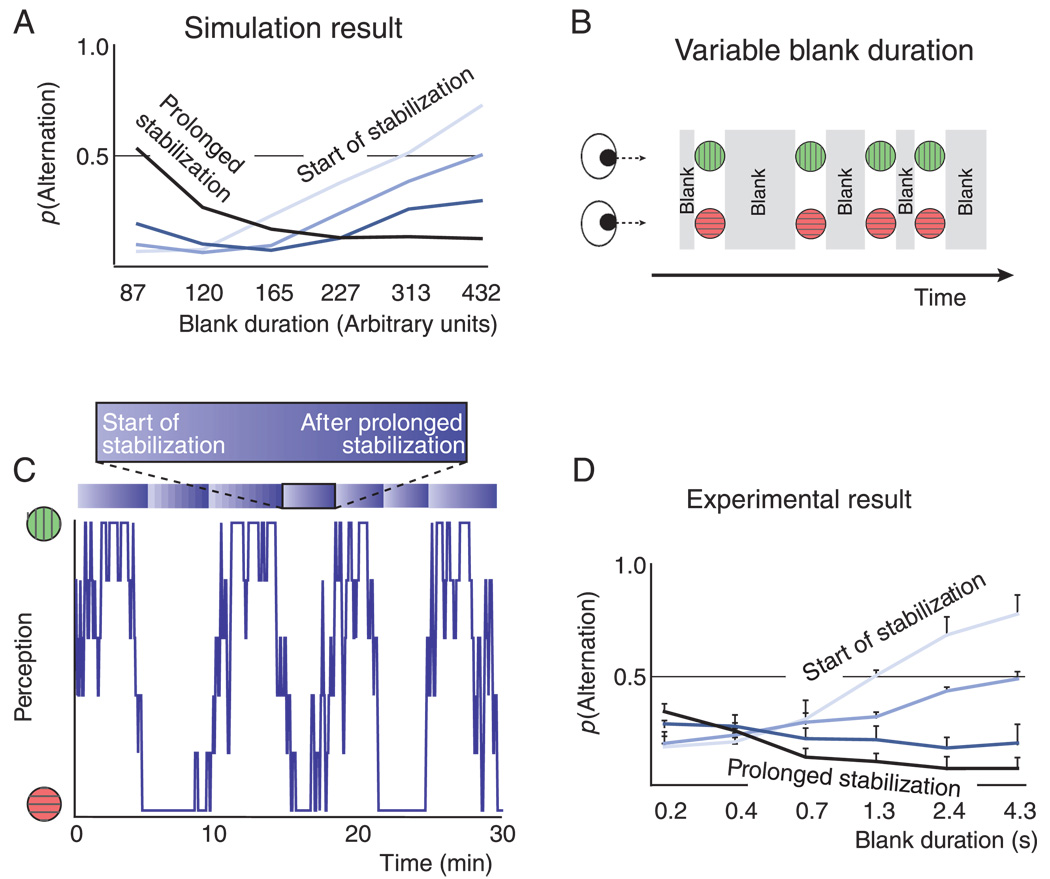
Figure 6.
Model prediction and empirical test. (A) Simulation result. The model predicts that the probability of an alternation should rise with blank duration at the beginning of a stabilization period (light curve), but fall with blank duration toward the end of a stabilization period (dark curve). During the periods in between these two extremes the relation between blank duration and alternation probability should be intermediate (intermediate colors). (B) Experimental timeline. A binocular rivalry stimulus was presented intermittently, with a variable blank duration between consecutive presentations. (C) Perception during a typical session (box car filtered with a window size of 5 presentations to enhance clarity). Perception alternated often between both interpretations, but there were underlying periods during which the same interpretation dominated on the vast majority of presentations. In our analysis we separated data into groups according to the position within such a period of relatively stable perception, ranging from ‘at the start of stabilization’ to ‘after prolonged stabilization’. This is schematically indicated above the plot. (D) Experimental result. Relation between blank duration (x-axis) and the probability of a perceptual alternation from a given presentation to the next (y-axis). At the beginning of stabilization (light curve) long blank durations promote alternations. After prolonged stabilization (dark curve) long blank durations promote stability. Intermediate shades correspond to intermediate stages of the stabilization sequence. These findings agree with the model prediction (Figure 6A). Error bars are standard errors of the mean (n = 4).

