
Fig. 2.
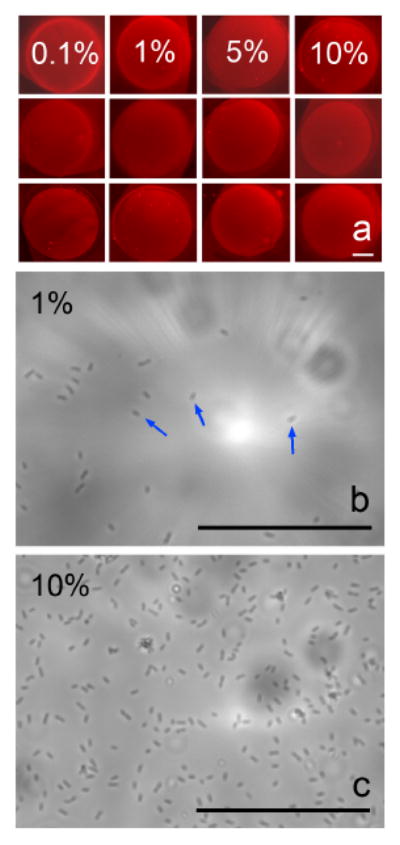
(a) Fluorescence microscope images of a 3×4 lipid bilayer microarray containing the indicated percentage of mannose-linked lipids (0.1-10%) in each column. The red color comes from TR-DHPE; (b) & (c) Zoomed-in optical microscope image (inside the boundary of each SLB spot) of E-coli 178 adsorbed on the lipid bilayer spots containing 1% and 10% mannose. The adsorbed E-coli appears as elongated spots, as illustrated by blue arrows. Scale bars = 50 μm.