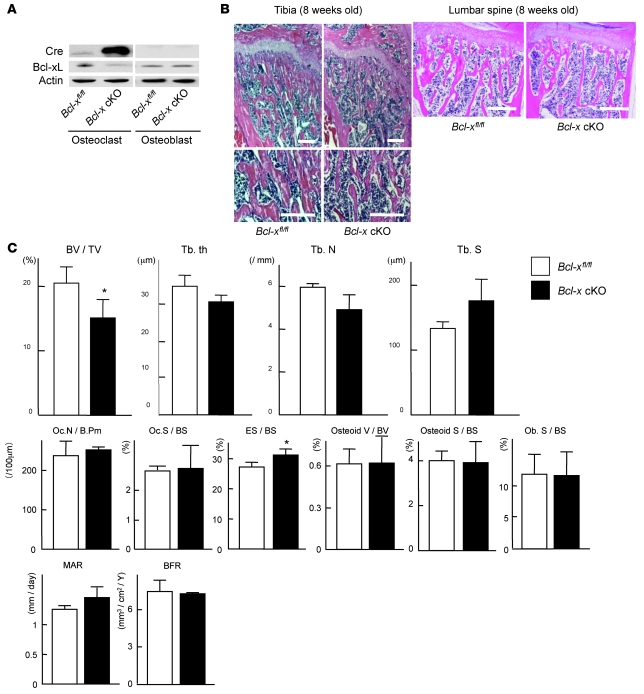
Figure 2. Generation and skeletal analysis of Bcl-x cKO mice.
(A) Western blotting of Cre recombinase and Bcl-xL in Bcl-x cKO mice and their normal Bcl-xfl/fl littermates using β-actin as an internal control. Bcl-xL expression was markedly reduced in osteoclasts, but not in osteoblasts, of Bcl-x cKO mice. (B) Histological sections of proximal tibia and lumbar spine of male Bcl-x cKO mice and their normal Bcl-xfl/fl littermates at 8 weeks of age. Bcl-x cKO mice exhibited reduced bone mass. Scale bars: 100 μm. (C) Histomorphometric analysis of male Bcl-x cKO mice and their normal Bcl-xfl/fl littermates at 8 weeks of age. Bone volume per trabecular volume (BV/TV) significantly decreased in Bcl-x cKO mice (P < 0.01). Trabecular bone thickness (Tb.th) and trabecular bone number (Tb.N) was reduced, and the trabecular separation (Tb.S) was increased, in Bcl-x cKO mice, with marginal statistical difference (P < 0.1). As for osteoclast markers, whereas the eroded surface/bone surface (ES/BS) significantly increased in Bcl-x cKO mice (P < 0.05), neither osteoclast number nor osteoclast surface increased. The parameters of bone formation in Bcl-x cKO mice were equivalent to those of normal littermates. Results are mean ± SD of 3 different samples. *P < 0.01 versus normal Bcl-xfl/fl littermates. Oc.N/B.Pm, number of mature osteoclasts per 100-μm bone perimeter; Oc.S/BS, bone surface covered by mature osteoclasts; Osteoid V/BV, osteoid volume per bone volume; Osteoid S/BS; osteoid surface per bone surface; Ob.S/BS, bone surface covered by cuboidal osteoblasts; MAR, mineral apposition rate; BFR, bone formation rate.

