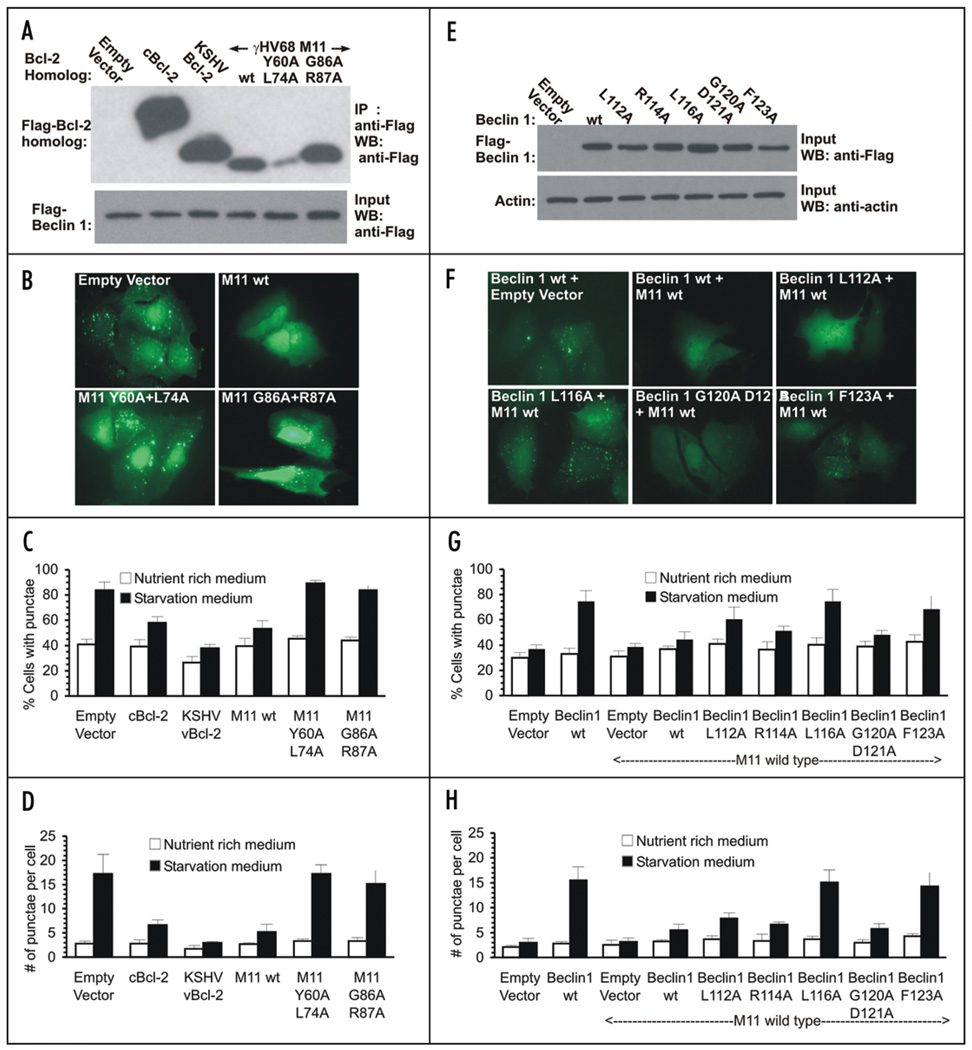
Figure 4.
The M11-Beclin 1 interaction is essential for the downregulation of autophagy by M11. (A) Expression of cBcl-2, KSHV Bcl-2, γHV68 M11 and M11 mutants in MCF7.beclin 1 cells. (B) Representative images of GFP-LC3 staining in MCF7.beclin 1 cells cotransfected with GFP-LC3 and the indicated plasmid. (C) Light microscopic quantification of the percentage of GFP-positive MCF7.beclin 1 cells with discrete puncta, co-transfected with GFP-LC3 and the Bcl-2 homolog or mutant indicated below the x-axis. (D) Light microscopic quantification of the number of discrete GFP-LC3 puncta per cell in GFP-positive MCF7.beclin 1 cells co-transfected with GFP-LC3 and the Bcl-2 homolog or mutant indicated below the x-axis. (E) Expression of Flag-tagged wt and mutant Beclin 1 constructs in MCF7 cells. Wt M11 was expressed at uniform levels in cells co-transfected with the M11 plasmid. (F) Representative images of GFP-LC3 staining in MCF7 cells cotransfected with GFP-LC3 and the indicated plasmids. (G) Light microscopic quantification of the percentage of GFP-positive MCF7 cells with discrete puncta, co-transfected with GFP-LC3, wt M11 and Beclin 1 or Beclin 1 mutants as indicated below the x-axis. (H) Light microscopic quantification of the number of discrete GFP-LC3 puncta per cell in GFP-positive MCF7 cells co-transfected with GFP-LC3, wt M11 and Beclin 1 or Beclin 1 mutants, as below the x-axis. For (C–F), results shown represent mean ± S.E.M. Similar results were obtained in three independent experiments.

