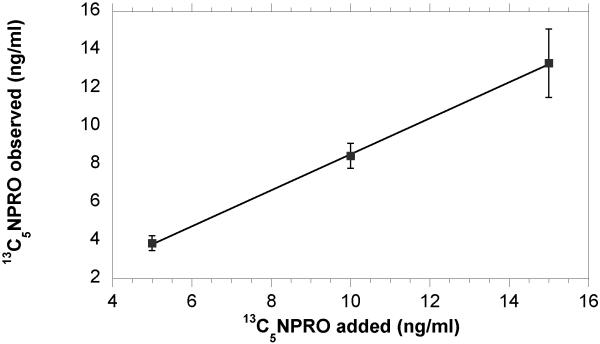
Figure 4.
The graph shows the concentration of 13C5 NPRO that was added at 5, 10 and 15 ng/ml of urine (x-axis) versus the 13C5 NPRO concentration (ng/ml) found following extraction and derivatization (y-axis). The percent return from these levels was 77, 84 and 89%, respectively. Data points and error bars are the mean (± SD) of 3 replicate measurements. The regression coefficient for linear fit was 0.944 and the goodness-of-fit for the regression model was R2= 0.9997.

