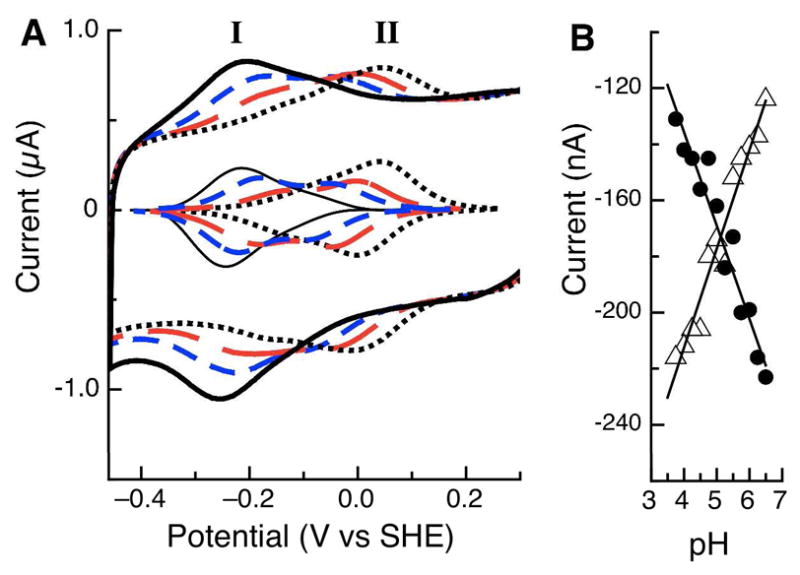
Figure 5.

(A) Raw and baseline-subtracted data for Psa CcP studied at PGE electrodes, as a function of pH. pH values of 7 (black), 6 (blue), 5 (red) and 4 (dotted black) are shown. (B) Maximum values of the peak current for the cathodic half-scan for features I (λ) and II (Δ), as a function of pH.
