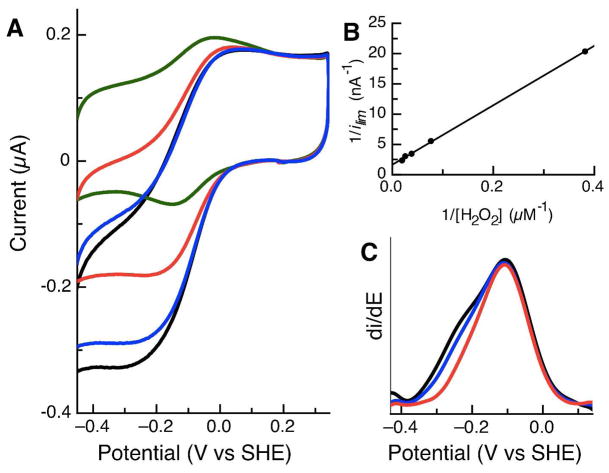
Figure 8.
Electrocatalytic reduction of hydrogen peroxide at a PGE electrode with Psa CcP adsorbed. (Experimental conditions: pH 7, scan rate = 10 mV/s, rotation rate = 2000 rpm.) (A) Voltammograms were collected at 3, 13, 26 and 40 μM hydrogen peroxide (green, red, blue and black traces, respectively). (B) Lineweaver-Burke plot of Psa CcP turnover of substrate. (C) Effect of increased substrate concentration on shape of the catalytic voltammogram. The first derivative of the catalytic current at 13, 40 and 60 μM hydrogen peroxide (red, blue and black traces, respectively).

