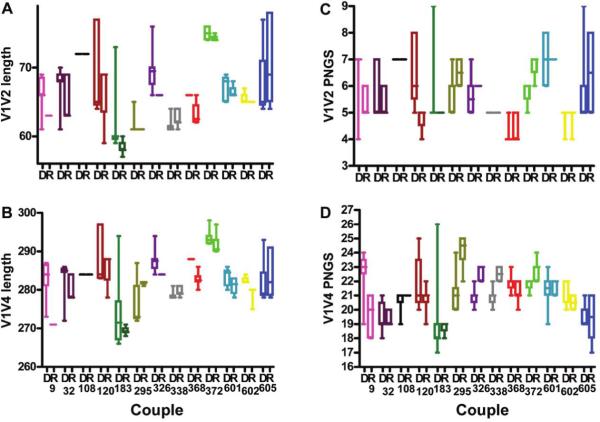
Figure 3.
V1-V2 length (A), V1–V4 length (B), V1V2 potential N-linked glycosylation sites (C), and V1-V4 potential N-linked glycosylation sites (D) for donors (D) and recipients (R), showing that transmitted viruses in Uganda have shorter envelopes. Boxes, interquartile ranges; horizontal lines, median values.

