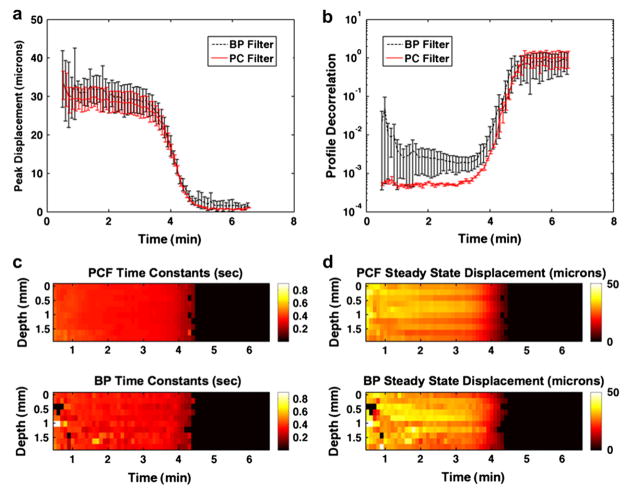
Fig. 11.
(a) The average peak displacement from 10 displacement profiles rendered across a 2-mm window in depth are displayed. Average peak displacements are shown for each sonorheometry interrogation, which occurred every 6 s and are displayed from 0.5 min to 6.5 min. Results illustrate the peak displacement values obtained via bandpass filtering (BP Filter) versus complex PCF (PC Filter) of the RF data prior to TDE. Error bars indicate the standard deviation added to (top) or subtracted from (bottom) the average over 10 ranges. (b) Average decorrelation values (one minus correlation) between the displacement profiles and a viscoelastic Voigt model with added mass are illustrated; error bars indicate the mean ± the standard deviation over 10 depths. Images are rendered across a 2-mm window of the blood sample for (c) time constants and (d) steady-state displacement. Viscoelastic parameters determined after complex PCF are shown on top, and derived parameters after bandpass filtering are shown on bottom. Parameter values in (c) and (d) are masked when the displacement profile fit the viscoelastic model with < 0.95 correlation.

