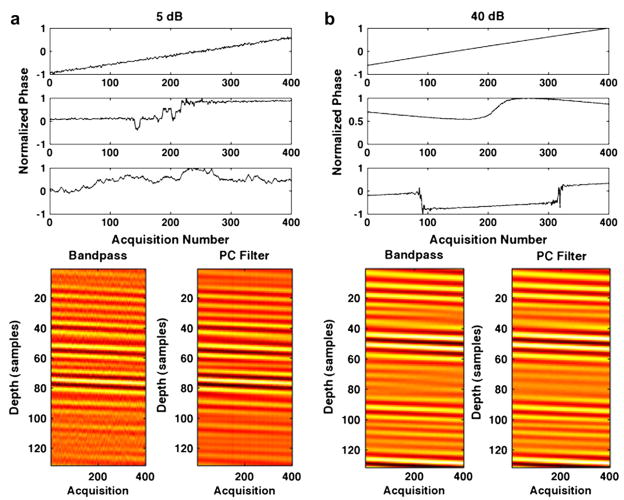
Fig. 4.
Filtered ensembles of RF are illustrated after either bandpass filtering (left) or complex PCF (right) applied to ensembles of RF simulated with (a) 5-dB SNR (bottom) and (b) 40-dB SNR (bottom). The normalized phase of associated PCs are displayed for (a) the 5-dB SNR instance (top) and (b) the 40-dB SNR instance (top). The PCs are shown with the first, most energetic PC on the top and the third PC on the bottom.

