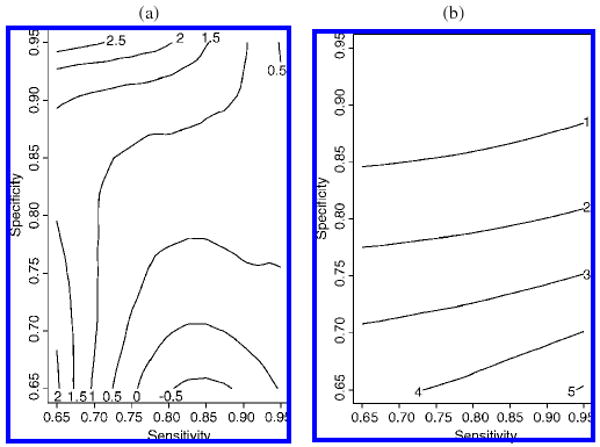
Figure 1.

Contour plot of relative asymptotic bias in sensitivity and specificity for 50% completely at random verification when the true model is a GRE model with Pd = .20, σ0 = 1.5, σ1 = 3, and J = 5. Relative asymptotic bias of sensitivity and specificity is defined as (SENS* ′ SENS)/SENS (a) and (SPEC* ′ SPEC)/SPEC (b), respectively. The contour plot was generated for sensitivities and specificities over an equally spaced grid ranging from .65 to .95 with 400 points.
