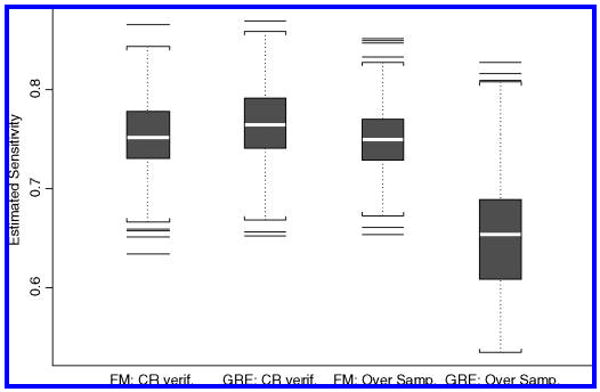
Figure 2.

Distribution of estimates of sensitivity using the FM and GRE model under completely random (CR) verification as well as under oversampling. Data were simulated under an FM model with J = 5, I = 1,000, SENS = .75, SPEC = .90, Pd = .2, η1 = .5, and η0 = .2. One thousand simulated realizations were obtained.
