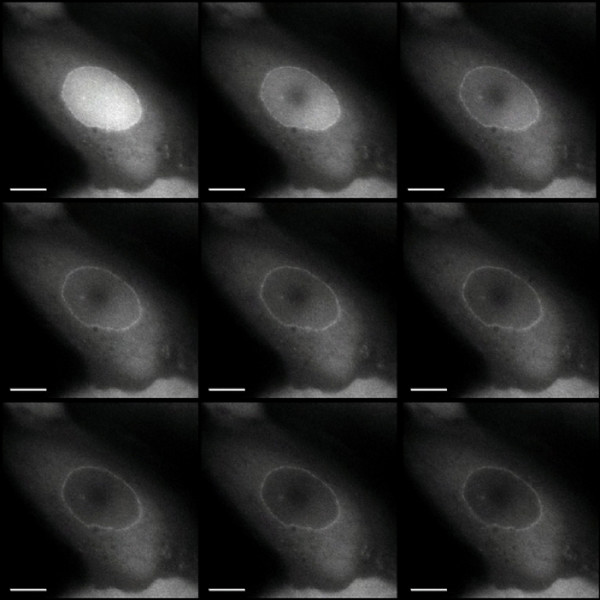
Figure 3.
FLIP analysis of GFP-RanQ69L .Images of a cell expressing nuclear GFP-RanQ69L (top left) and after successive cycles of photobleaching within a defined spot within the nucleus (left to right, top to bottom). The cell was subjected to 100 cycles of laser-bleaching, each of 20 ms duration and images collected at 250 ms intervals are shown. See additional file 1: movie 1 for the original data used to perform this analysis.

