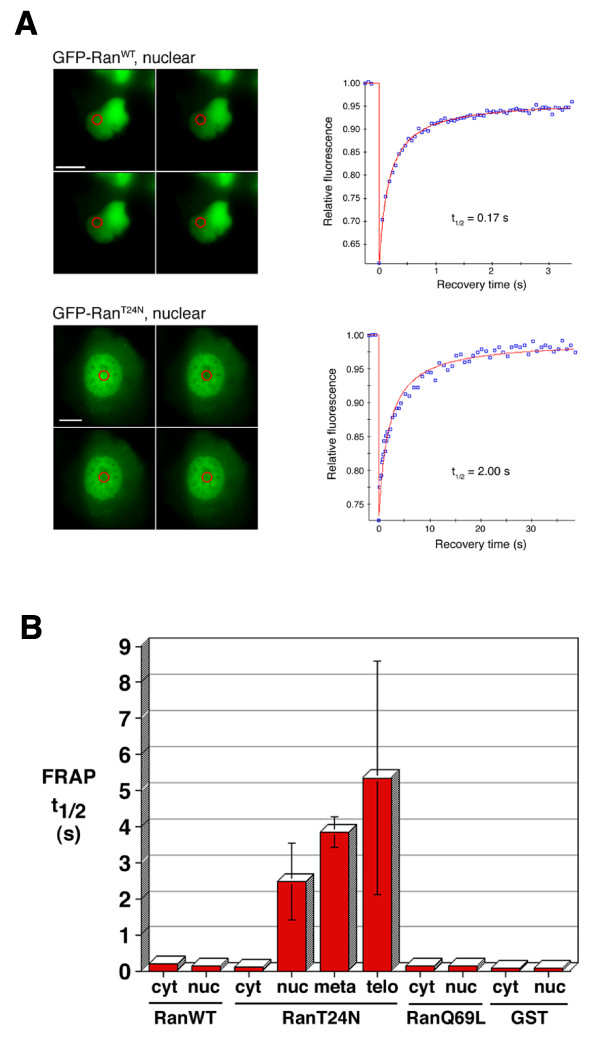
Figure 7.
FRAP analysis of GFP-Ran proteins. (A) Example FRAP experiments focused on the nuclei of GFP-RanWT- and GFP-RanT24N-transfected U2OS cells. Left, fluorescence images of cells; in each panel, top left image shows a cell before bleaching then successive images left to right, top to bottom after bleaching. Scale bars, 10 μm. Right, plots showing recovery of the fluorescence signal in each case and the calculated t1/2. (B) Differences in FRAP t1/2 values between different forms of Ran, during progression through the cell cycle and in different subcellular compartments: cyt, interphase cytoplasm; nuc, interphase nucleus; meta, metaphase chromatin; telo, telophase chromatin.

