Figure 3.
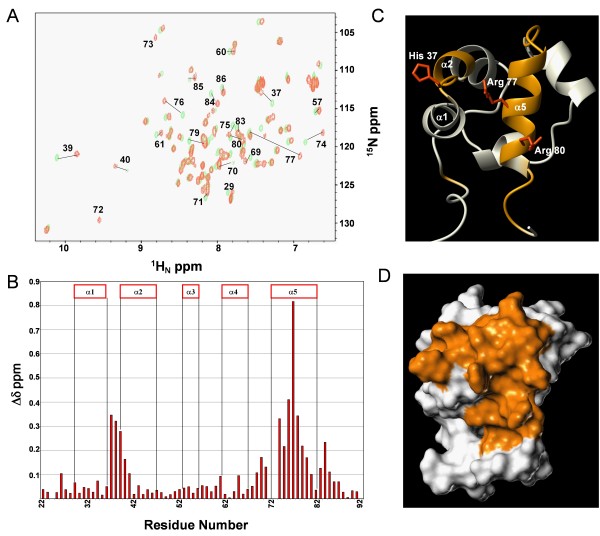
Mapping the Arap3-Sam binding interface for Ship2-Sam. A. Superposition of [1H, 15N]-HSQC spectra of 15N labeled Arap3-Sam (100 μM concentration) in the apo form (green) and after addition of unlabeled Ship2-Sam (200 μM) (orange). B. Histogram of normalized chemical shift deviations (Δδ = [(ΔHN)2 + (0.17 * Δ15N)2]1/2) as function of the residue number. Δδ values > 0.1 ppm are observed for residues D26, H37, L38, E39, Q40, Y41, I69, S70, A71, H74, R75, K76, R77, I78, L79, R80, L81, Q83, T84, G85. Residues T72 and G73 have been omitted from the graph since the corresponding peaks can only be seen in the spectrum of the bound form. C. Ribbon drawing of Arap3-Sam (conformer number 1 of the NMR ensemble, pdb code: 2KG5) where the residues with the largest normalized chemical shift deviations (Δδ values > 0.1 ppm) are colored in orange; the side chains of the residues that we mutated, are also shown. D. Surface representation of Arap3-Sam in the same orientation and colored as in panel C.

