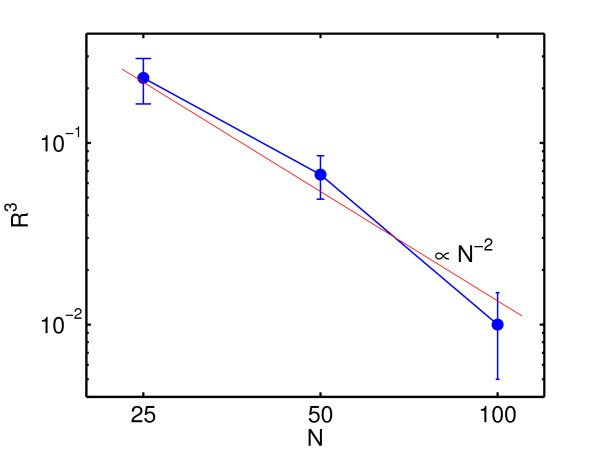
Figure 5.
Correlation coefficients versus network size. The averages and standard deviation of the associated R3 correlation coefficients have been computed and are plotted double logarithmically versus N. The straight line is the function AN-2 with A = 135 and demonstrates that a decay of R3 can be explained by power -2 of the network size, which agrees well with the fact that ( ) links have to be estimated from maximal N independent experiments. Networks of size N = 25 with average connectivity ⟨k⟩ = 5, N = 50 with ⟨k⟩ = 10, and N = 100 with ⟨k⟩ = 30 have been sampled and reconstructed for the assumed values of k = 1,..., N.

