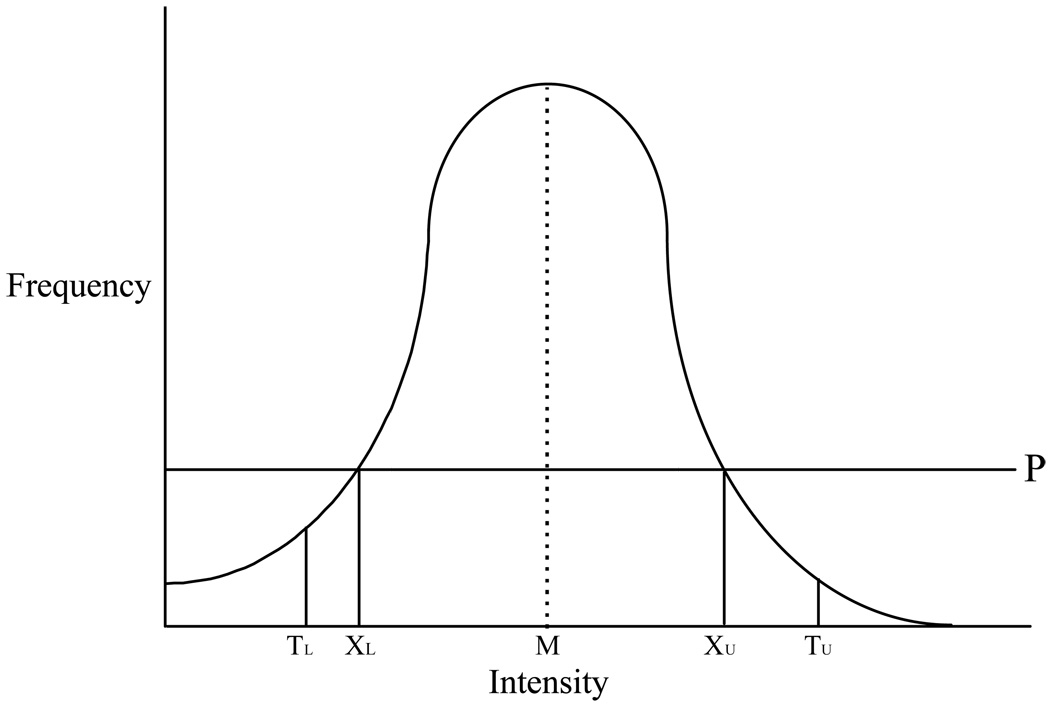
Figure 1. FLAIR Histogram.
Line drawing of the intensity histogram of a FLAIR image after the skull/scalp has been stripped away. The large central peak that makes up the bulk of the histogram is composed entirely of brain pixels. M refers to the mode value in the histogram. P is a horizontal line placed at one-third the height of the mode value. The values XL and XU represent the lower and upper points at which line P intersects the intensity histogram. The statistical properties of the central brain peak between XL and XU are used as independent variables in regression equations that are used to define values TL and TU, which are used to segment the histogram into three domains. Pixels to the left of TL are assigned to CSF; pixels between TL and TU are assigned to brain; and, pixels to the right of TU are assigned to leukoaraiosis lesion.

