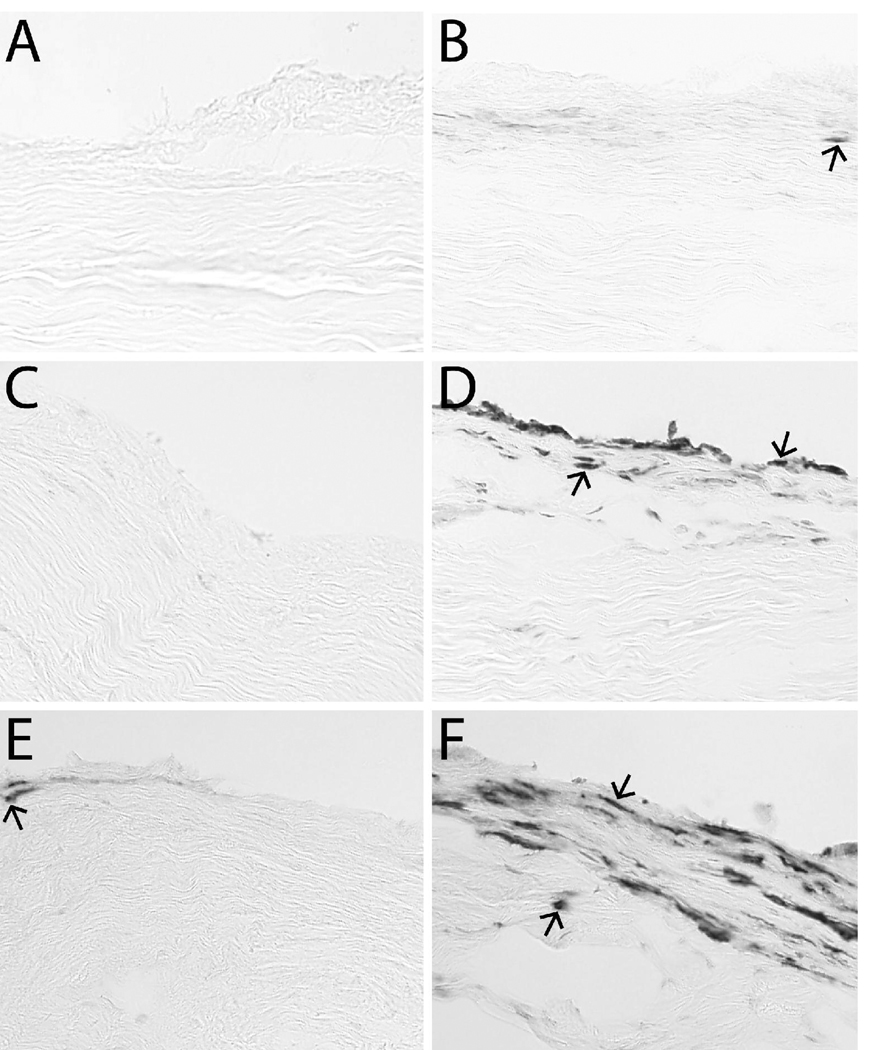
Figure 2. Immunohistochemistry Images.
No-injection controls (left column: A, C, E) and dextrose-injected ligaments six hours post-injection (right column: B, D, F). Dextrose-injected ligaments had similar numbers of CD43-positive lymphocytes (arrow) (B) compared to no injection (A). Dextrose-injected ligaments had more ED1-positive macrophages (arrows) (D) compared to no injection (C). Dextrose-injected ligaments had more ED2-positive macrophages (arrows) (F) compared to no injection (E).

