
Fig. 4.
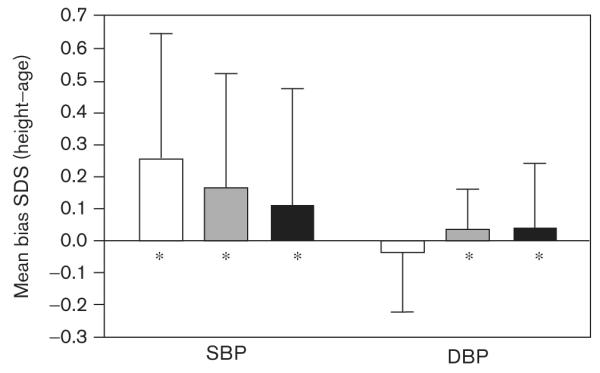
Mean bias for comparison of the height-based versus the age-based standard deviation scores (SDS) for systolic blood pressure (SBP) and diastolic blood pressure (DBP). Values represent the mean ± standard deviation. *Significant difference (P< 0.01) in values obtained by the two methods.