Figure 2.
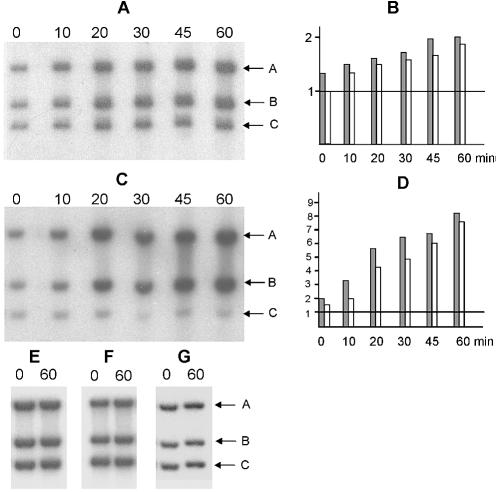
Southern blot analysis of directionality of N15 replication. (A) Total cellular DNA was isolated from strains VK-1 (A and E), VK-2/pCA12 (C and F) and VK-3 (G) at times indicated above the blots (in min) post-activation of replication, fractionated by 0.5% (w/v) agarose electrophoresis and hybridized to radiolabeled probes A, B and C (see text). Positions of the fragments that hybridize to these probes are shown by arrows. Replication was activated by shifting the temperature from 40 to 30°C (A) or by simultaneous temperature shift and induction of anti- repressor by adding arabinose to the medium up to 0.01% (C and G). Control experiments shown in (E and F) were performed exactly as experiments shown in (A and C) except that cultures were kept constantly at 40°C. (B and D) show the band intensities of probe A (gray rectangles) and B (white rectangles)-specific signals normalized to probe C-specific signal taken as 1.0. To obtain these quantitative data, each band was cut from the membrane after hybridization and exposure to X-ray film, and the radioactive signals were counted in an X-ray counter.

