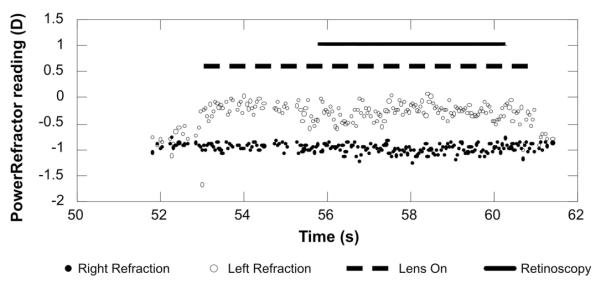
FIGURE 3.
Example of the absolute validation data. The PowerRefractor data from the right and left eyes are represented as a function of time by the filled and open symbols, respectively. An apparent anisometropia develops at 53 seconds when a lens was placed over the left eye. The dashed line illustrates the time that the lens was over the eye. The retinoscopy was performed on that eye between 56 and 60 seconds as shown by the solid line. The retinoscopy call was “against” and the mean PowerRefractor reading was −0.27 D.

