
Figure 2.
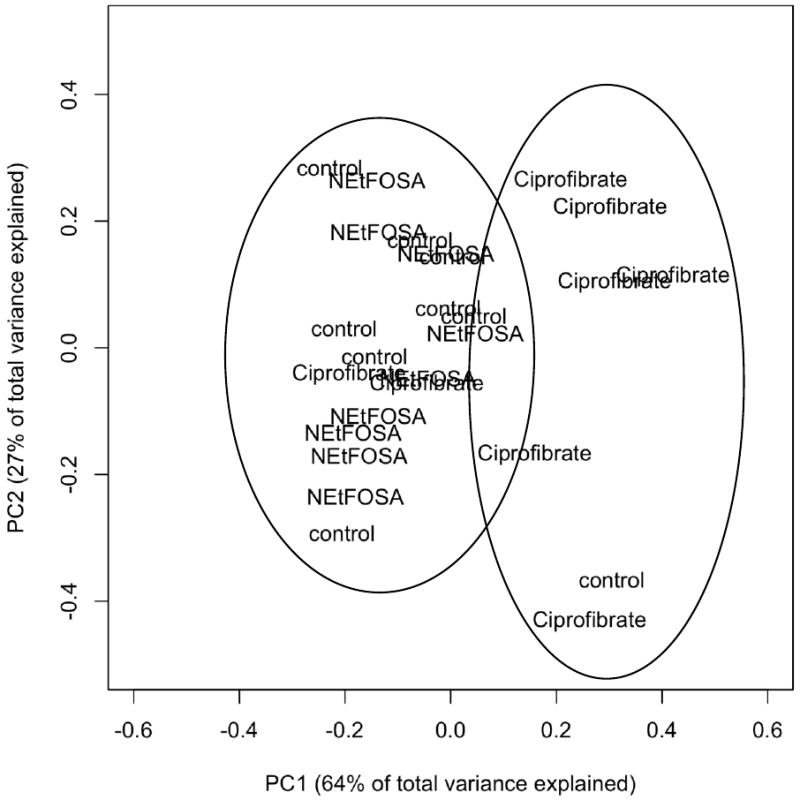
Projections of Principal Component 1 versus Principal Component 2 from the Principal Component Analysis (PCA) of the data from the metabolomic study reveal two groupings: One grouping with ciprofibrate-treated animals and a second grouping of N-EtFOSE-treated and control animal. Serum was mixed in a 1:1 ratio (v/v) with phosphate buffer (pH = 7.4) containing TSP as internal standard and CPMG spectra were recorded on a 600-NMR instrument as described under Materials and Methods. The spectra were integrated manually and adjusted for TSP prior to PCA. Each word-label in the Figure denotes one animal.