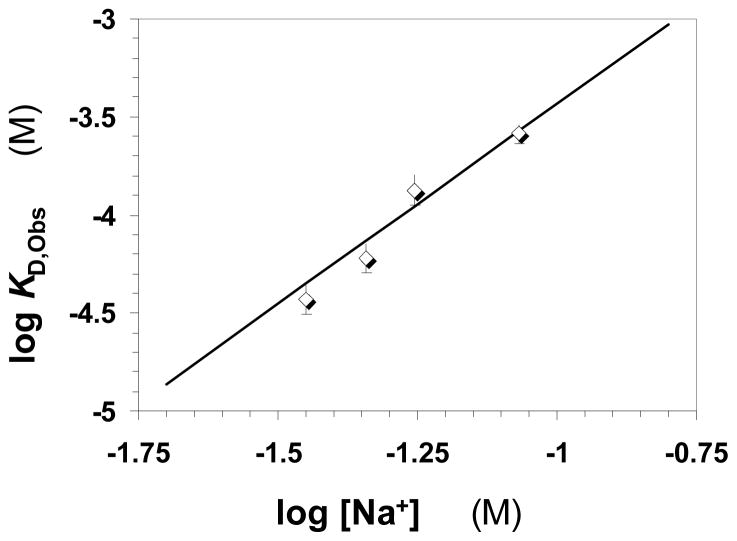
Figure 6.
Dependence of AT – IAS5 interaction affinity on the ionic strength of the medium at pH 7.4 and 25 °C. The binding affinities at various NaCl concentrations were measured as described in ‘Materials and Methods’ and shown in Figure 5. Solid line represents a linear regressional fit to the data using equation 3 to obtain the number of ionic interactions (Z) from the slope and the affinity due to non-ionic forces (KD, Non-ionic) from the intercept.

