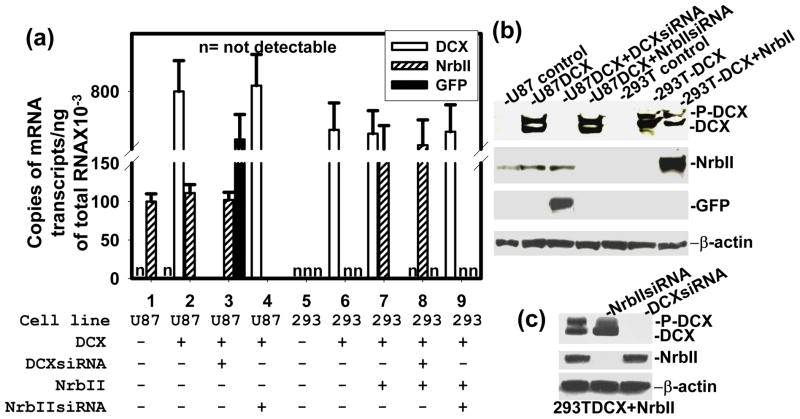
Fig. 6.
Analysis mRNA and proteins in transfected cells. Expression and knockdown of DCX, NrbII and GFP are analyzed by absolute qrtPCR in the transfected cells (shown at the bottom) (a). ‘n’ indicates that copies of mRNA are not detected. In Western blot, the transfected cells are shown at top (b), top and bottom (c) of the gel. Migration of protein bands are marked in right. The loading of samples was normalized with β-actin.

