
Figure 3.
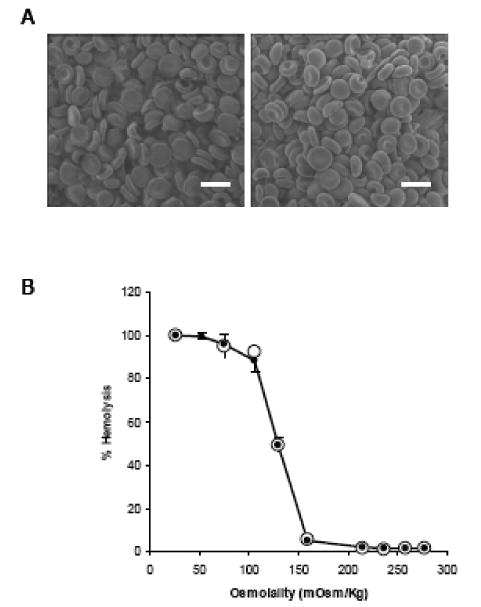
(A) Scanning electron microscopy (SEM) images of control, normal RBCs (left) and LMWP-ASNase-loaded RBCs (right). Cells were fixed with glutaraldehyde. Scale bar = 5 μm. (B) Osmotic fragility curve for control RBCs (●) and LMWP-ASNase-loaded RBCs (○).