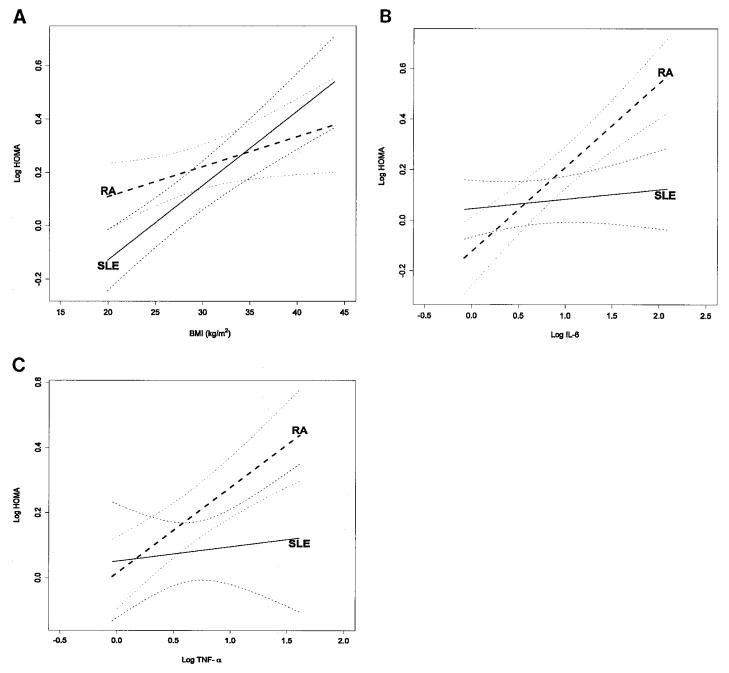
Figure 1.
Relationship between body mass index (BMI) (A), interleukin-6 (IL-6) (B), and tumor necrosis factor α (TNFα) (C) and the homeostasis model assessment (HOMA) index in patients with systemic lupus erythematosus (SLE) and rheumatoid arthritis (RA). A is adjusted for age, sex, race, and current use of corticosteroids, TNFα, IL-6, and C-reactive protein (CRP). P < 0.001 for SLE slope, P = 0.02 for RA slope, and P = 0.04 for interaction. B is adjusted for age, sex, race, BMI, current use of corticosteroids, TNFα, and CRP. P = 0.17 for SLE slope, P < 0.001 for RA slope, and P < 0.01 for interaction. C is adjusted for age, sex, race, BMI, current use of corticosteroids, IL-6, and CRP. P = 0.21 for SLE slope, P < 0.001 for RA slope, and P = 0.16 for interaction.

