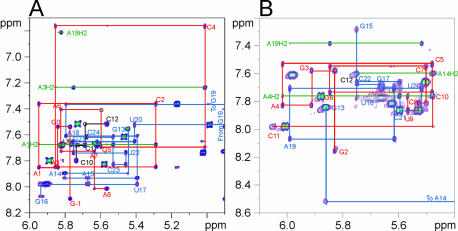
Figure 3.
NOESY spectra of the base proton–H1′ region of sNRE26 and b2NRE. (A) The 500 MHz NOESY spectrum of sNRE26 at 298 K and τm = 200 ms. Sequential connectivities from G –1 to A8, C10 to C12 and G13 to C24 are shown in red, black and blue, respectively. The base–H1′ sequential connectivities for G19 are not shown since it resonates upfield at 3.82 p.p.m. There is no base–H1′ sequential connectivity between A15 and G16; however, NOEs from A15–U17 are observed. In addition, NOEs from U17 to A15 indicate that the sugar of A15 is flipped. (B) The 600 MHz NOESY spectrum of b2NRE at 298 K and τm = 300 ms. Base–H1′ sequential connectivities from G2 to C11 and G13 to C22 are indicated by red and blue lines, respectively. A break in the sequential connectivities is observed between A14 and G15, which is due to the fact that the A13H1′ resonance is broadened to baseline at 298 K. In both spectra, the intranucleotide cross-peaks are labeled. In addition, peaks arising from AH2 resonances are indicated with green lines and labeled accordingly.

