Abstract
Electron tomography provides three-dimensional structural information about supramolecular assemblies and organelles in a cellular context but image degradation, caused by scattering of transmitted electrons, limits applicability in specimens thicker than 300 nm. We show that scanning transmission electron tomography of 1000 nm thick samples using axial detection provides resolution comparable to conventional electron tomography. The method is demonstrated by reconstructing a human erythrocyte infected with the malaria parasite Plasmodium falciparum.
Electron tomography (ET) provides a three-dimensional (3D) view of cellular ultrastructure at nanoscale spatial resolution, and thus gives unique insight into the supramolecular basis of biological processes. Although cryo-electron tomography of frozen-hydrated cells provides supramolecular structure that is closest to the native state1, room-temperature tomography of rapidly frozen, freeze-substituted, resin-embedded and stained preparations provides an important complementary approach for studying ultrastructure of large eukaryotic cells2. Typically, sections must be cut to a thickness of less than 300 nm to obtain high spatial resolution in tomograms recorded by conventional transmission electron microscopy (TEM). Recently, scanning transmission electron microscopy (STEM) using annular dark-field detection has also been used to investigate thicker samples3, but 3D resolution is limited due to beam spreading effects. Here we present an alternative approach to electron tomography that yields 3D reconstructions of thick (around1μm) sections at resolutions comparable to conventional ET of thinner sections. The ability to perform 3D reconstructions from larger volumes is particularly attractive for studying unicellular eukaryotic microorganisms, some of which are sufficiently small to be contained within just a few serial sections4,5. We also anticipate that electron tomography of serial thick sections will markedly facilitate the 3D reconstruction of entire mammalian cells6.
Conventional bright-field electron tomographic tilt series are obtained by collecting electrons that have traversed a specimen illuminated by a broad beam. Using this approach, the thickness is limited by the severe image blurring that occurs when electrons that have undergone multiple energy losses (Supplementary Fig. 1) are focused by the objective lens of the microscope7. Furthermore, the area of the specimen to be imaged is limited by the depth of field of the objective lens, so that only part of the sample is in focus at high tilt angles (Supplementary Fig. 2a).
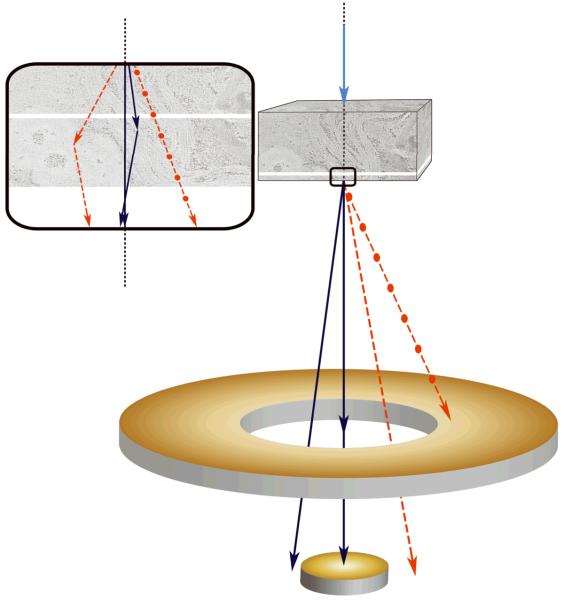
Scanning transmission electron tomography using a tightly focused electron probe can overcome some of the limitations imposed by conventional ET (Supplementary Discussion 1). First, because the incident STEM probe can be focused at any point in a specimen, large areas are imaged at focus even for high tilt angles (Supplementary Fig. 2b). Second, because in STEM there are no image-forming lenses after the specimen, the resolution attainable in images of thick specimens is not further degraded by electrons that have suffered multiple energy losses. The most commonly applied STEM approach makes use of a high angle annular dark-field (HAADF) detector to collect electrons that are scattered to high angles8. HAADF STEM typically employs an incident electron probe with large convergence angle, and can provide diffraction-limited sub-Ångstrom resolution for imaging radiation-resistant materials when the probe-forming objective lens is equipped with a spherical aberration corrector9. The HAADF STEM technique, however, is not well suited to imaging thick biological specimens because of the limited depth of field defined by the large convergence angle of the incident electron probe (Supplementary Fig. 3). A 10-fold or higher increase in depth of field is possible by adjusting the microscope optics to decrease the convergence semi-angle down to approximately 1–2 mrad10. Another limiting feature of HAADF STEM as applied to imaging thick specimens is the severe degradation in spatial resolution that occurs towards the bottom surface of a section due to beam broadening11. In contrast, we found that much higher spatial resolutions can be obtained by collecting only those electrons that are scattered to low angles, i.e., by using an axial bright-field (BF) detector12. The basis for achieving higher resolution with axial detection is depicted schematically in Figure 1a. Electrons that undergo multiple elastic scattering are substantially displaced from the point of incidence of the STEM probe (red lines), and possess on average larger net scattering angles. A significant fraction of these electrons can thus be excluded from images recorded with an axial detector, leading to an improvement in spatial resolution towards the bottom surface of thick specimens. We have quantified this unexpected improvement in resolution using Monte Carlo electron-trajectory simulations12 (Supplementary Fig. 4; Supplementary Discussion 2).
Figure 1.
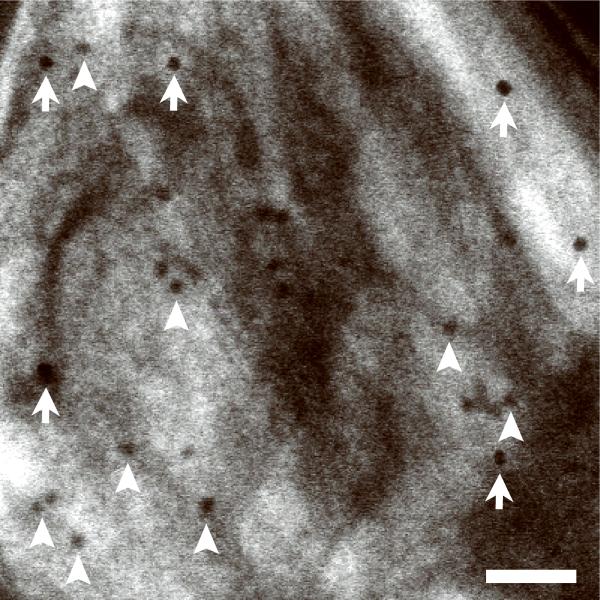
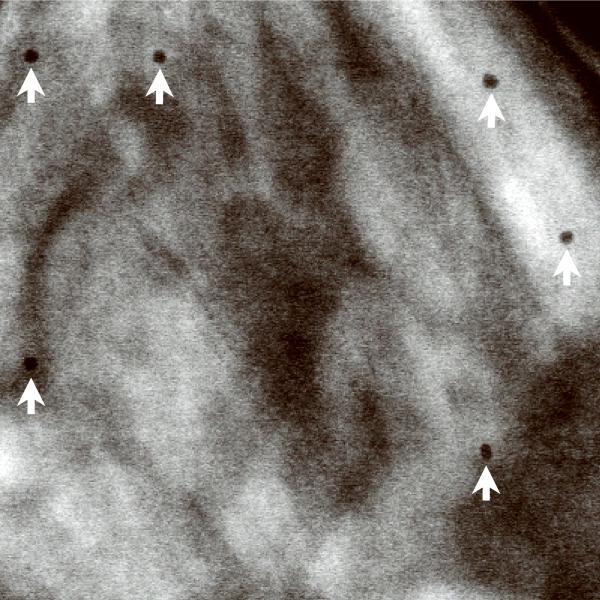
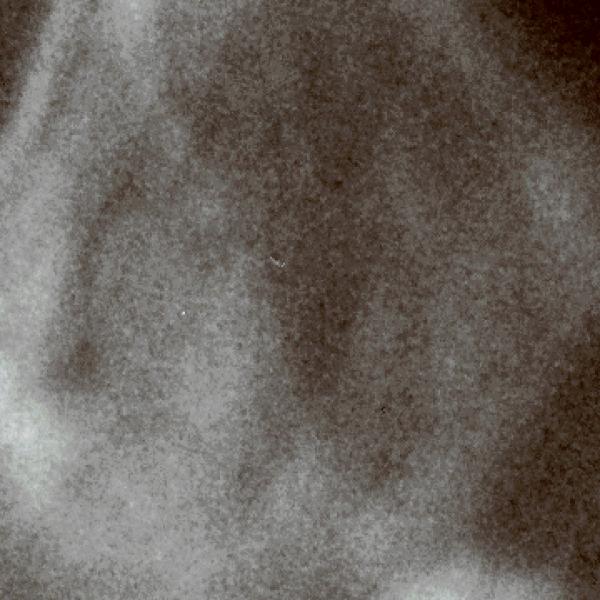
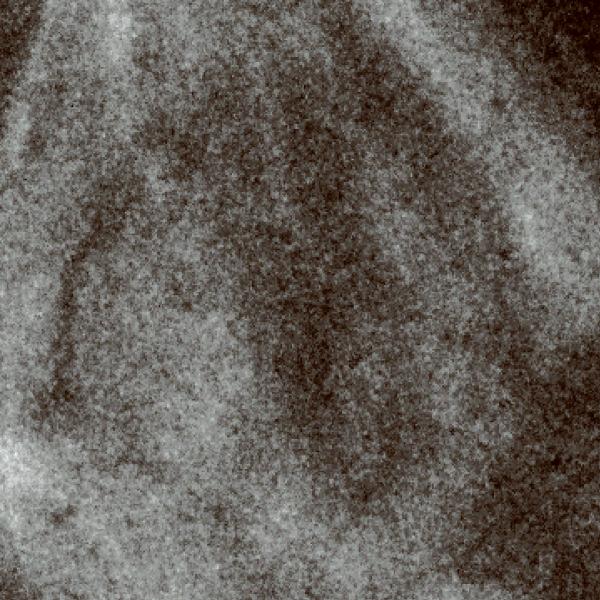
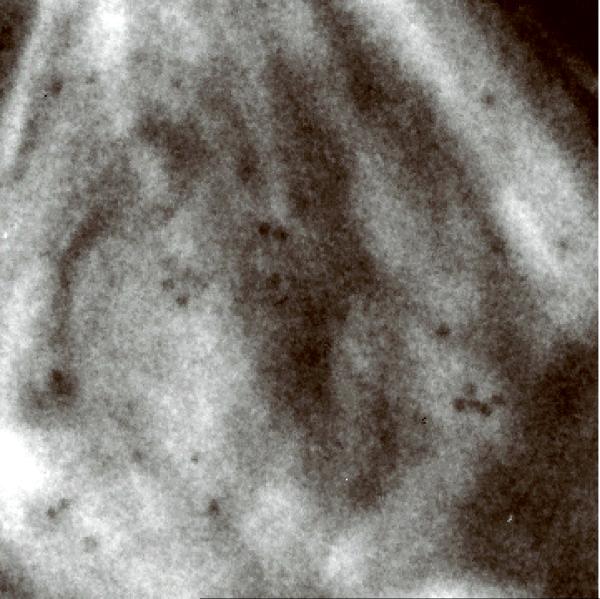
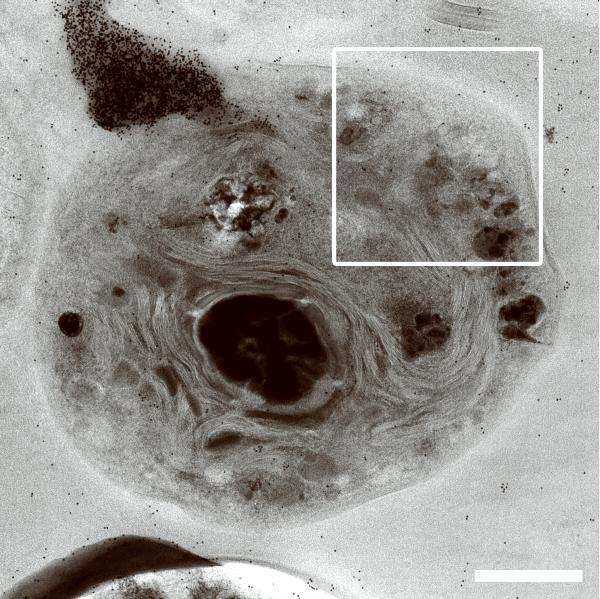
Scanning transmission electron microscopy using axial detection. (a) Schematic diagram depicting the influence of STEM detector configuration on the spatial resolution of specimen features situated towards the bottom of thick sections. Light blue arrow represents a STEM probe incident on a thick specimen. Dark blue lines represent electrons that arrive at the bottom of the specimen with little displacement from the center of the probe, whereas red dashed lines represent electrons that arrive at the bottom with large displacements from the center. Black dotted line indicates the central axis through the specimen defined by the center of the incident STEM probe. Inset: detail of bottom region of specimen showing electron trajectories resulting in small displacements (blue lines) and large displacements (red lines) relative to the center of the probe. (b–f) Projection images from a 1 μm-thick section of P. falciparum-infected erythrocyte. BF STEM revealing particles both on top surface (arrows) and bottom surface (arrowheads) (b), HAADF STEM with contrast inverted showing only particles on top surface (arrows) (c), conventional TEM (d), and energy-filtered TEM at the most-probable energy-loss (e,f). Electron dose was 103 e/nm2 in all images except in f, for which the dose was 104 e/nm2. Scale bar, 100 nm.
To demonstrate the superior performance of BF in relation to HAADF STEM in imaging thick sections, we recorded images of 20 nm gold particles situated at the top and bottom surfaces of a densely stained 1 μm-thick section of P. falciparum-infected erythrocyte (Fig. 1b,c; Supplementary Fig. 5a,b). As expected, particles at the top surface (arrows) were easily visible in both imaging modes. Conversely, particles situated at the bottom surface of the section were not visible in HAADF STEM due to significant beam broadening. However, in BF STEM these particles could be imaged with good contrast and resolution (arrowheads). BF STEM imaging also revealed fine structural details that were not apparent with HAADF STEM. Additional images (Fig. 1d–f; Supplementary Fig. 5c–e) also illustrate the superior performance of BF STEM in relation to traditional TEM and energy-filtered TEM7 for thick-section imaging. A brief comparison between BF and HAADF STEM tomograms is given in Supplementary Figure 6 as well.
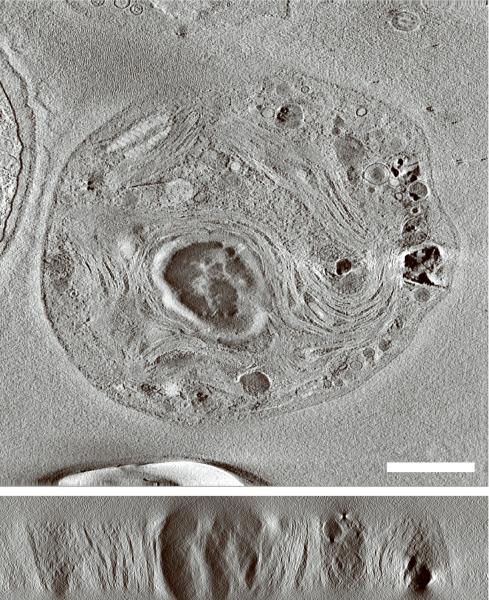
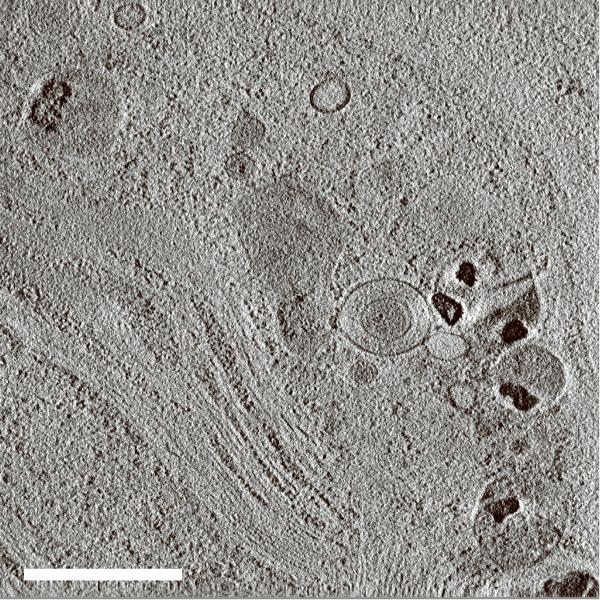
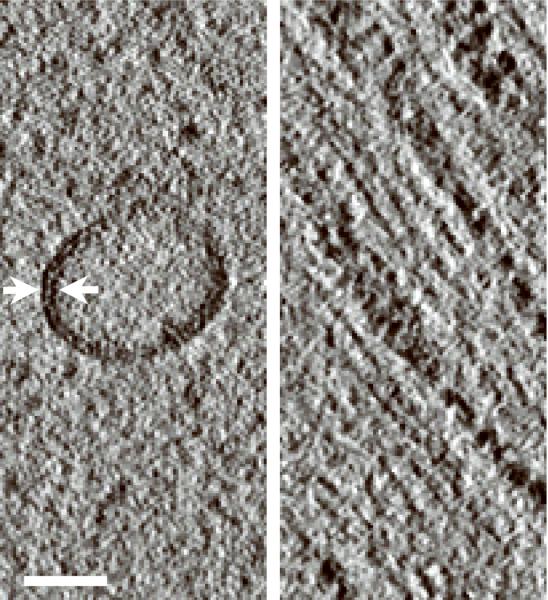
We have evaluated the axial BF STEM approach using an incident probe of low convergence to reconstruct 1μm-thick plastic sections of Chlamydomonas reinhardtii (Fig. 2a; Supplementary Fig. 7a). In addition to all the features typical of eukaryotes, this green alga also contains stacked photosynthetic membranes making it an ideal object for assessing resolution in a tomogram. A recorded BF STEM tomogram with a pixel size of 2.8 nm showed an entire C. reinhardtii cell in the xy plane (Fig. 2b; Supplementary Fig. 7b). A slice across the reconstructed 3D volume revealed many ultrastructural features such as the cell nucleus, membrane stacks of the chloroplast, cytoplasmic vesicles, and ribosomes dispersed throughout the cell. A more detailed tomogram with a pixel size of 1 nm was obtained from a selected 2 × 2 μm2 area of the cell (Fig. 2c; Supplementary Fig. 7c). The stacked membranes of the chloroplast were easily discernible within a slice taken across the tomogram, and two dark lines that delineate the two membrane faces of a vesicle were also easily resolved, indicating a resolution of better than 5 nm. At greater sample depth, beam broadening caused some decrease in resolution. However, slices taken across the very bottom of the tomogram clearly revealed individual thylakoid stacks, indicating that the resolution was still within 10 nm (Supplementary Fig. 8).
Figure 2.
Bright-field STEM tomography of 1 μm-thick C. reinhardtii. (a) 2D projection image of entire C. reinhardtii in the xy plane. (b) 25-nm thick slices across the xy (top panel) and xz (bottom panel) planes of BF STEM tomogram. (c) 10-nm thick slice across tomogram recorded from the region marked in a. (d) Expanded areas from tomogram in c showing fine ultrastructural details. Left panel: the two faces of a vesicle membrane are resolved indicating a resolution within 5 nm (arrows). Right panel: membranes of thylakoid stacks. Scale bars, 1 μm (a,b), 500 nm (c), 50 nm (d).
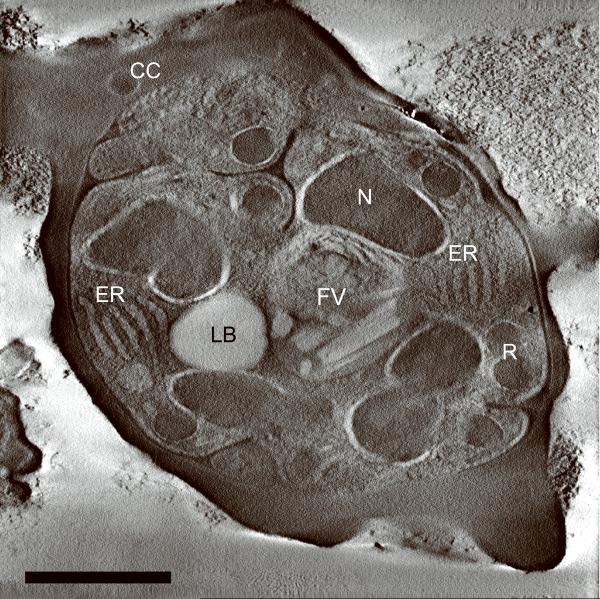
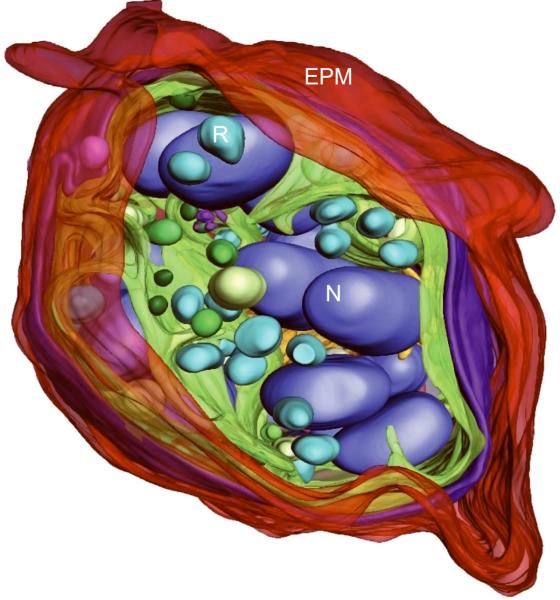
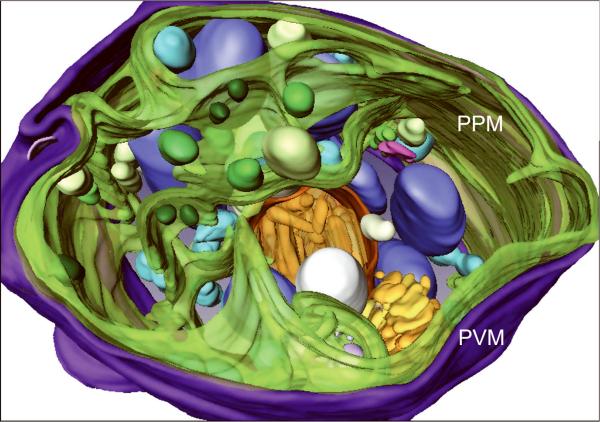
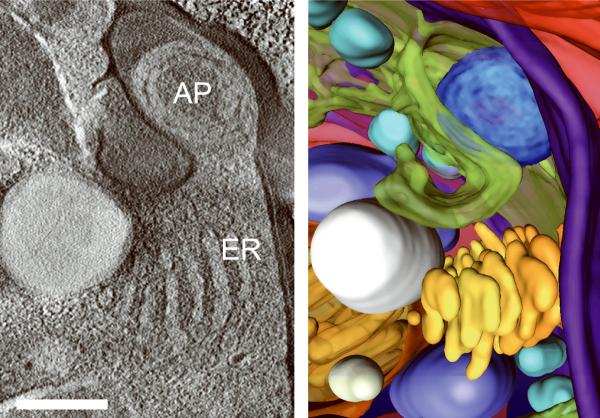
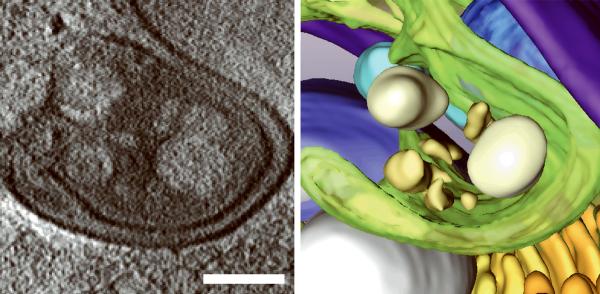
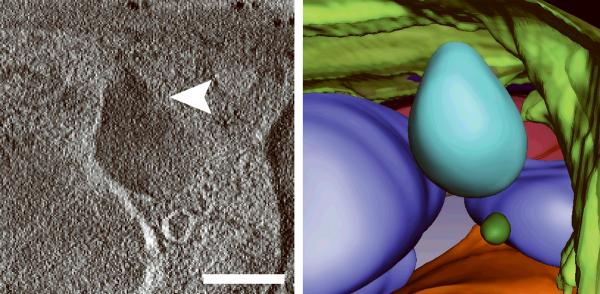
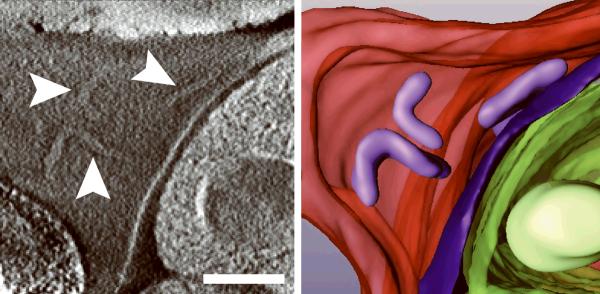
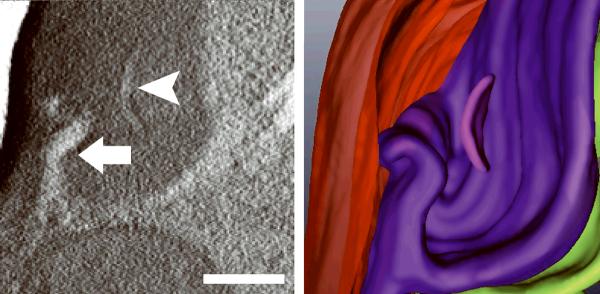
Generating high resolution STEM tomograms from entire cells that span several micrometers in depth can be accomplished by imaging serial thick sections (Supplementary Fig. 9). Here we demonstrate the feasibility of reconstructing from only four consecutive 1 μm-thick sections an entire human erythrocyte infected with the pathogen Plasmodium falciparum, the causative agent of malaria. Tomogram slices of one infected erythrocyte (Fig. 3a; Supplementary Fig. 10) revealed the parasite during the process of schizogany, i.e. multiple nuclear divisions and formation of new parasites. At this stage of the parasite cycle, active morphogenesis multiplies or produces de novo intracellular organelles for up to 32 new parasites within one schizont4. The dynamics of organellogenesis and morphogenesis is poorly understood13 because of the laborious procedure of conventional 3D reconstructions from serial thin sections. Using STEM tomography with an axial detector, however, enables the more rapid reconstruction of entire schizonts, which allows a series of cells to be studied and the sequence of morphological events to be established. The 3D model (Fig. 3b–h) derived from the tomogram revealed the spatial arrangement of several major organelles, including nuclei, rhoptries, food vacuole, Golgi complex, apicoplast and lipid body. The structure formed by several stacked cisternae (Fig. 3a,d) is thought to be an endoplasmic reticulum. To the best of our knowledge, this putative endoplasmic reticulum with its pronounced series of cisternae appears significantly different from those visualized previously in P. falciparum by conventional electron microscopy of thin sections, and thus a conclusive identification of this very unusual structure requires further examination. In addition to organelles, three layers of membranes surrounding the schizont were clearly identifiable: 1) the parasite plasma membrane, caught here at the onset of invagination to form new parasites, 2) the membrane of the parasitophorus vacuole, and 3) the erythrocyte membrane. Parasite-derived membrane structures (e.g., tubular extensions of the vacuolar membrane, Maurer's clefts and circular clefts) were visible inside erythrocyte cytoplasm as well (Fig. 3a,g,h). Thus, a new ultrastructural method is now available to study the complex dynamics of malaria parasite development inside human erythrocytes.
Figure 3.
3D ultrastructure of human erythrocyte infected with malaria parasite P. falciparum. (a) 20-nm thick slice across BF STEM tomogram obtained from a 1 μm-thick section (see also Supplementary Figure 10). (b,c) Rendered 3D model of an infected erythrocyte. In c, the erythrocyte plasma membrane (EPM) and some organelles were removed to show the parasitophorous vacuole membrane (PVM) and parasite plasma membrane (PPM). (d–h) Slices across tomogram (left) with 3D models of the same regions (right). (d) Apicoplast, endoplasmic reticulum (see text for details), lipid body and PPM. (e) Several putative Golgi cisternae surrounded by an invaginating PPM. (f) Rhoptry with typical pear-shaped outline (arrowhead). (g) Parasite-derived membrane structures in the cytoplasm of erythrocyte (arrowheads). (h) Tubular extension of PVM (arrow) and putative Maurer's cleft (arrowhead). Abbreviations: nucleus (N), rhoptry (R), food vacuole (FV), endoplasmic reticulum (ER), apicoplast (AP), lipid body (LB), circular cleft (CC). Scale bars, 1 μm (a), 400 nm (d), 200 nm (e–h).
In summary, this report demonstrates the feasibility and advantages of STEM tomography using axial detection for imaging thick sections at a spatial resolution around 5–10 nm, which is comparable to the spatial resolution of traditional ET from thinner sections (typically 3–8 nm). Most modern electron microscopes can be operated in STEM mode and can be readily equipped with a BF detector, which is anticipated to facilitate implementation of the technique. The demand for high-resolution, large-volume imaging of biological specimens has been addressed so far by the large scale application of traditional ET of thin sections2,6,14,15. The present study suggests that it will be possible to reconstruct intact organelles, intracellular pathogens, and even entire mammalian cells through serial thick-section STEM tomography. Axial STEM tomography could also be useful for the 3D characterization of multiphase polymers, biomaterials and other soft materials.
ONLINE METHODS
Specimen preparation
We grew Chlamydomonas reinhartii under 70 μmol photons/(m2 · s) incandescent illumination at 23 °C on inorganic growth medium (Carolina Scientific, USA). Cells in logarithmic growth phase were harvested by centrifugation. We cultured Plasmodium falciparum strain 3D7 (American Type Culture Collection, USA) in human erythrocyte and isolated late-stage infected cells from synchronized cultures using a Percoll-enrichment procedure as described before16.
C. reinhardtii and P. falciparum-infected erythrocytes that had been briefly pre-fixed with 0.16% paraformaldehyde for biosafety were frozen using a HPM-010 high-pressure freezing machine (Bal-Tec, Liechtenstein). Although some nanoscale alteration in structure possibly occurs during pre-fixation, other structural changes due to dehydration are minimized by subsequent cryofixation. We freeze-substituted frozen cells in 1% osmium tetroxide for 48–72 hours before warming up to room temperature over the course of 48 hours. Upon reaching room temperature we infiltrated the samples with Spurr's resin using a decreasing acetone-resin gradient (10%, 20%, 40%, 80%, 100% resin) followed by a second 100% resin infiltration step and subsequent polymerization at 65 °C.
We sectioned the plastic-embedded samples to a nominal thickness of 1 μm using a Leica Ultracut E ultramicrotome (Leica Microsystems, Germany), and picked up serial thick sections with a loop. The loop containing the sections was then used to pick up a copper slot grid of 1 mm slot width, such that the sections were oriented side by side along the length of the hole in the slot grid (Supplementary Fig. 9). We left the loop with the slot grid plus sections under the warm light of a dissecting microscope until the water evaporated. We then affixed the serial sections to the copper slot grid by gently touching the edges of each section with a pipette tip that contained acrylate glue. This procedure generated very stable samples that easily withstood further handling for staining and application of fiducial gold markers. Next, we stained sections containing infected erythrocytes with 0.5 wt% uranyl acetate and 0.5 wt% lead citrate (SPI Supplies, USA) in water for 15–20 minutes each. Finally, we applied gold fiducial markers of 20 nm in diameter (SPI Supplies) to both sides of all plastic sections, followed by deposition of a 10 nm-thick layer of amorphous carbon.
Electron microscopy instrumentation
For electron microscopy we used a Tecnai TF30 transmission electron microscope (FEI Company, USA) operating at an acceleration voltage of 300 kV and equipped with a Schottky field-emission gun. This microscope is fitted with a Gatan STEM bright-field detector (Gatan, USA) situated after the viewing screen, as well as with a Model 3000 in-column high angle annular dark-field detector (Fischione, USA) situated after the projection-lens system and above the viewing screen. In addition, this instrument is equipped with a Tridiem post-column imaging filter (Gatan) and a 2048 × 2048 pixel Ultrascan CCD detector (Gatan) situated after the post-column filter.
Image acquisition
We recorded unfiltered transmission electron microscopy (TEM) images (Fig. 1d; Supplementary Fig. 5c) and most probable energy-loss (MPEL) TEM images (Fig. 1e,f; Supplementary Fig. 2a; Supplementary Fig. 5d,e) using DigitalMicrograph (Gatan) with 2048 × 2048 pixels, 32-bit grayscale, and pixel size of 2.4 nm. For MPEL TEM imaging we used an energy window of 30 eV centered at the maximum in the energy-loss spectrum (Supplementary Fig. 1). Because the imaged sections were thick, and because of beam spreading, there was no single defocus that would be optimum along the entire specimen thickness17. We thus selected a value of defocus near the z-center of the section that led to the best overall image quality. Images were slightly adjusted for brightness and contrast.
We recorded scanning transmission electron microscopy (STEM) images (Fig. 1b,c; Fig. 2a; Supplementary Fig. 2b; Supplementary Fig. 5a,b,f; Supplementary Fig. 7a) using the Tecnai Imaging and Analysis (TIA) software (FEI Company) with 2048 × 2048 pixels, 16-bit grayscale, and pixel size of 2.8 nm. We adjusted images slightly for brightness and contrast. The incident electron probe had a convergence semi-angle of 1.6 mrad, which was obtained by inserting the smallest probe-forming condenser aperture in the microscope in addition to interactively adjusting the second condenser and objective lens currents10,18. Bright-field (BF) STEM imaging was performed with a 15 mrad detector outer semi-angle, and high angle annular dark-field (HAADF) STEM was carried out with an inner semi-angle of 40 mrad (outer semi-angle was around 200 mrad). We achieved control over these collection angles by varying the magnification of the diffraction pattern (camera length).
For acquisition of the series of images displayed in Figure 1 and Supplementary Figure 5, the plastic sections were first pre-irradiated and stabilized under the electron beam. We recorded images following the same order as shown in the figures, namely, BF STEM and HAADF STEM (recorded simultaneously), unfiltered TEM, MPEL TEM (low dose) and MPEL TEM (high dose). The electron doses were 103 e/nm2, except for the second MPEL TEM image for which the dose was 104 e/nm2. To confirm that the sections had been properly stabilized prior to collecting the series of images, a final BF STEM image was recorded and checked against the first image (Supplementary Fig. 5f).
STEM tomography
To perform STEM tomography, we employed automatic sample tilting, focusing and image shift correction using Xplore3D (FEI Company). Beam convergence semi-angle and detector collection semi-angles were as stated above. We obtained tomographic image tilt series of both C. reinhardtii and P. falciparum at two different magnifications with pixel sizes of 2.8 nm and 1 nm, and corresponding total electron doses of 2.0 × 10⁴ and 1.6 × 10⁵ e/nm2, respectively. Images contained 2048 × 2048 pixels providing scanned specimen areas of 5.7 × 5.7 μm2 and 2 × 2 μm2. The STEM tomograms were calculated from single-axis tilt series ranging from −60° to 60° with increments of 1.5°. Where BF and HAADF STEM reconstructions are presented from the same specimen region (Supplementary Fig. 6), we acquired BF and HAADF STEM tilt series simultaneously allowing for an unambiguous comparison between the tomograms obtained with each technique.
3D reconstructions19,20 were computed from the tilt series using a weighted back-projection algorithm in the IMOD software package (University of Colorado, USA)21. The tomograms were generated after binning images by 2 and post-processed with a 3D median filter of size 2. We created 3D models in Amira (Visage Imaging, Germany) by guided segmentation.
Supplementary Material
Figure 4.
Figure 5.
Figure 6.
Figure 7.
Figure 8.
Figure 9.
Figure 10.
Figure 11.
Figure 12.
Figure 13.
Figure 14.
Figure 15.
Figure 16.
Figure 17.
Figure 18.
ACKNOWLEDGMENT
This work was supported by the Intramural Research Programs of the National Institute of Biomedical Imaging and Bioengineering, and the National Institute of Child Health and Human Development of the National Institutes of Health. M.F.H-M. would like to acknowledge support through the Joint National Institute of Standards and Technology / National Institute of Biomedical Imaging and Bioengineering Postdoctoral Associateship Program of the National Research Council, USA
REFERENCE LIST
- 1.Baumeister W. FEBS Lett. 2005;579:933–937. doi: 10.1016/j.febslet.2004.10.102. [DOI] [PubMed] [Google Scholar]
- 2.Hoenger A, McIntosh JR. Curr. Opin. Cell Biol. 2009;21:1–8. doi: 10.1016/j.ceb.2008.12.003. [DOI] [PMC free article] [PubMed] [Google Scholar]
- 3.Aoyama K, Takagi T, Hirase A, Miyazawa A. Ultramicroscopy. 2008;109:70–80. doi: 10.1016/j.ultramic.2008.08.005. [DOI] [PubMed] [Google Scholar]
- 4.Bannister LH, Hopkins JM, Fowler RE, Krishna S, Mitchell GH. Parasitology Today. 2000;16:427–433. doi: 10.1016/s0169-4758(00)01755-5. [DOI] [PubMed] [Google Scholar]
- 5.Henderson GP, Gan L, Jensen GJ. PLoS ONE. 2007;2:e749. doi: 10.1371/journal.pone.0000749. [DOI] [PMC free article] [PubMed] [Google Scholar]
- 6.Marsh BJ. Methods Cell Biol. 2007;79:193–220. doi: 10.1016/S0091-679X(06)79008-2. [DOI] [PubMed] [Google Scholar]
- 7.Bouwer JC, et al. J. Struct. Biol. 2004;148:297–306. doi: 10.1016/j.jsb.2004.08.005. [DOI] [PubMed] [Google Scholar]
- 8.Ziese U, Kübel C, Verkleij AJ, Koster AJ. J. Struct. Biol. 2002;138:58–62. doi: 10.1016/s1047-8477(02)00018-7. [DOI] [PubMed] [Google Scholar]
- 9.Batson PE, Dellby N, Krivanek OL. Nature. 2002;418:617–620. doi: 10.1038/nature00972. [DOI] [PubMed] [Google Scholar]
- 10.Hyun JK, Ercius P, Muller DA. Ultramicroscopy. 2008;109:1–7. doi: 10.1016/j.ultramic.2008.07.003. [DOI] [PubMed] [Google Scholar]
- 11.Gentsch P, Gilde H, Reimer L. J. Microsc. 1974;100:81–92. [Google Scholar]
- 12.Sousa AA, Hohmann-Marriott MF, Zhang G, Leapman RD. Ultramicroscopy. 2009;109:213–221. doi: 10.1016/j.ultramic.2008.10.005. [DOI] [PMC free article] [PubMed] [Google Scholar]
- 13.van Dooren GG, et al. Mol. Microbiol. 2005;57:405–419. doi: 10.1111/j.1365-2958.2005.04699.x. [DOI] [PubMed] [Google Scholar]
- 14.Marsh BJ, Mastronarde DN, Buttle KF, Howell KE, McIntosh JR. Proc. Natl. Acad. Sci. U.S.A. 2001;98:2399–2406. doi: 10.1073/pnas.051631998. [DOI] [PMC free article] [PubMed] [Google Scholar]
- 15.Höög JL, et al. Developmental Cell. 2007;12:349–361. doi: 10.1016/j.devcel.2007.01.020. [DOI] [PubMed] [Google Scholar]
- 16.Glushakova S, et al. Cell Microbiol. 2009;11:95–105. doi: 10.1111/j.1462-5822.2008.01242.x. [DOI] [PMC free article] [PubMed] [Google Scholar]
- 17.Reimer L, Ross-Messemer M. Ultramicroscopy. 1987;21:385–388. [Google Scholar]
- 18.Weyland M, Muller DA. Nanosolutions. 2005;1:24–35. [Google Scholar]
- 19.McEwen BF, Marko M. J. Histochem. Cytochem. 2001;49:553–564. doi: 10.1177/002215540104900502. [DOI] [PubMed] [Google Scholar]
- 20.Koster AJ, Grimm R, Typke D, Hegerl R, Stoschek A, Walz J, Baumeister W. J. Struct. Biol. 1997;120:276–308. doi: 10.1006/jsbi.1997.3933. [DOI] [PubMed] [Google Scholar]
- 21.Kremer JR, Mastronarde DN, McIntosh JR. J. Struct. Biol. 1996;116:71–76. doi: 10.1006/jsbi.1996.0013. [DOI] [PubMed] [Google Scholar]
Associated Data
This section collects any data citations, data availability statements, or supplementary materials included in this article.


