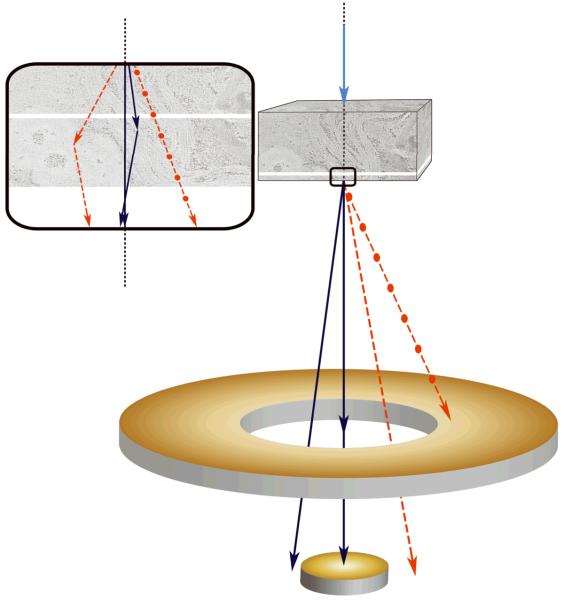
Figure 1.
Scanning transmission electron microscopy using axial detection. (a) Schematic diagram depicting the influence of STEM detector configuration on the spatial resolution of specimen features situated towards the bottom of thick sections. Light blue arrow represents a STEM probe incident on a thick specimen. Dark blue lines represent electrons that arrive at the bottom of the specimen with little displacement from the center of the probe, whereas red dashed lines represent electrons that arrive at the bottom with large displacements from the center. Black dotted line indicates the central axis through the specimen defined by the center of the incident STEM probe. Inset: detail of bottom region of specimen showing electron trajectories resulting in small displacements (blue lines) and large displacements (red lines) relative to the center of the probe. (b–f) Projection images from a 1 μm-thick section of P. falciparum-infected erythrocyte. BF STEM revealing particles both on top surface (arrows) and bottom surface (arrowheads) (b), HAADF STEM with contrast inverted showing only particles on top surface (arrows) (c), conventional TEM (d), and energy-filtered TEM at the most-probable energy-loss (e,f). Electron dose was 103 e/nm2 in all images except in f, for which the dose was 104 e/nm2. Scale bar, 100 nm.

