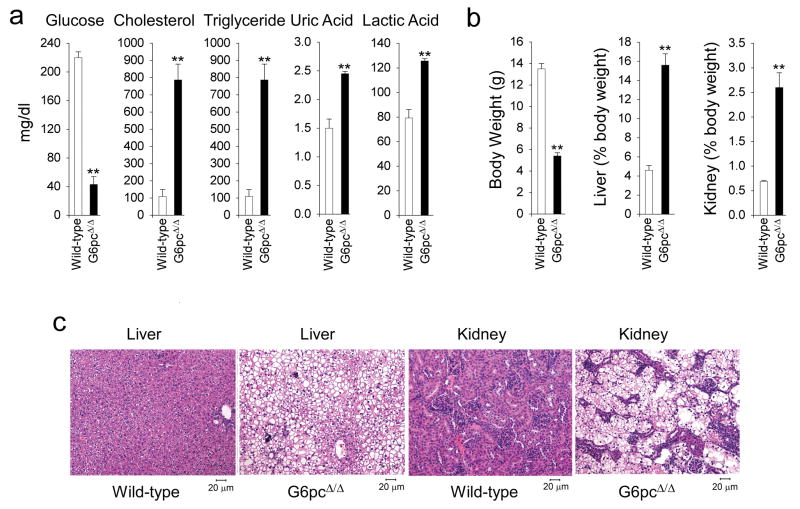
FIG. 2.
The G6pcΔ/Δ mice manifest a phenotype of disturbed glucose homeostasis. Metabolic functions were analyzed in 3-week-old G6pcΔ/Δ and wild-type mice. (a) Serum glucose, cholesterol, triglyceride, uric acid, and lactic acid levels. Data are presented as mean ± SEM. **p < 0.005. (b) The body weight and the weights of the liver and kidney relative to total body weight. Data are presented as mean ± SEM. **p < 0.005. (c) H&E stained liver and kidney sections from G6pcΔ/Δ and wild-type mice with magnifications of ×200.

