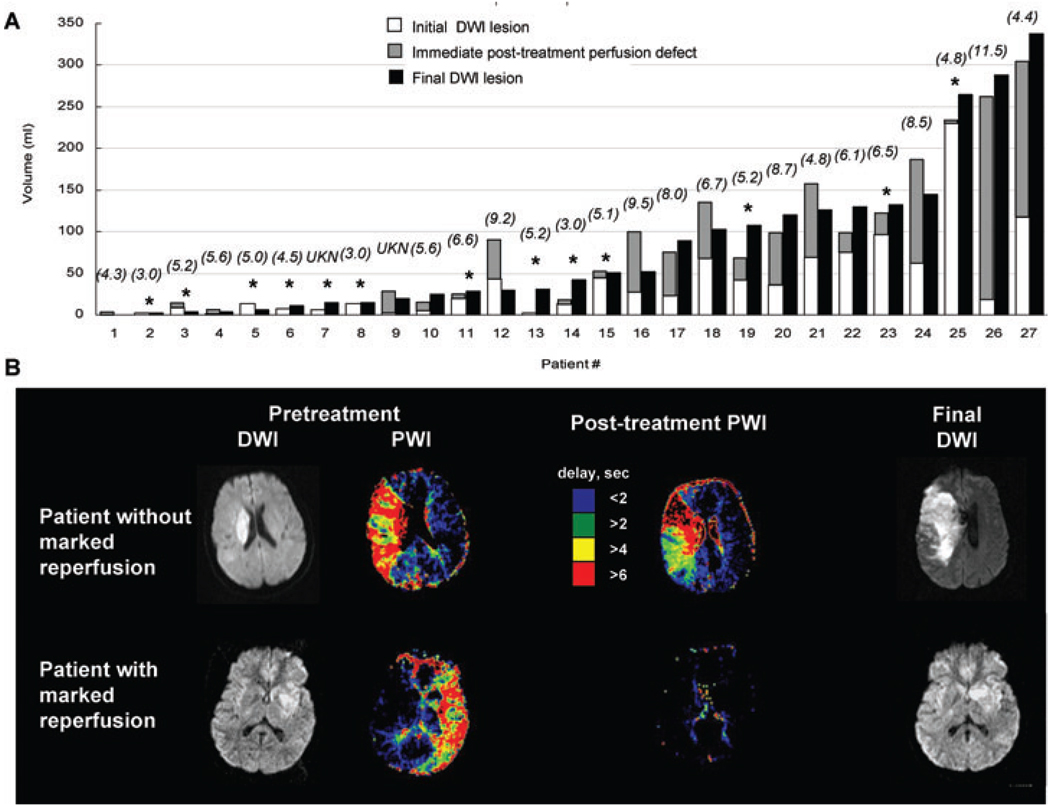
Fig 2.
(A) Volume of initial and final DWI lesions and posttreatment perfusion defect. (B) MRI findings that show the DWI changes in patients (upper) without and (lower) with marked improvement in perfusion defect on immediate posttreatment PWI. Numbers in parenthesis represent time from last known well time to start of endovascular therapies. *Marked reperfusion. UKN = patient who developed symptoms during sleep.

