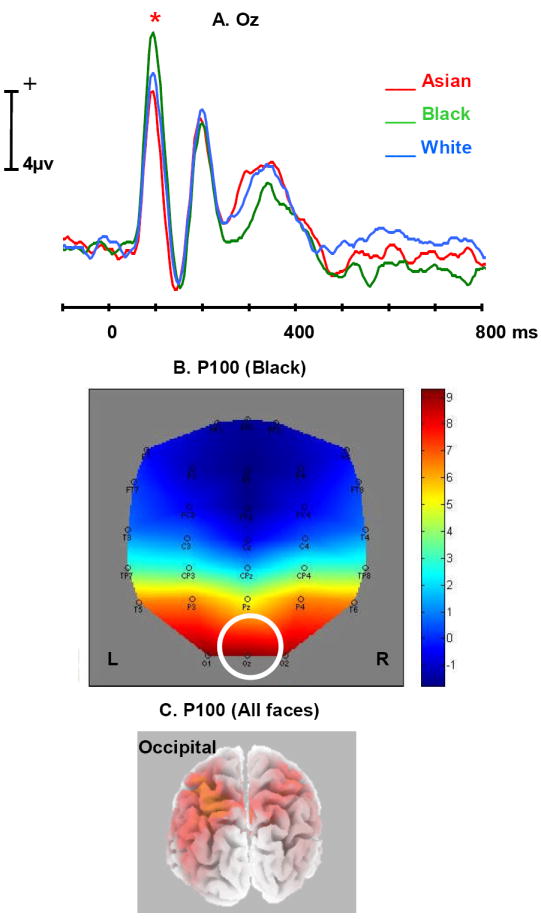
Figure 2.

A. Average ERP time waves for Asian (red), Black (green), and White (blue) at the Oz electrode, illustrating the difference in P100 amplitude (indicated by *).
B. Topographic map illustrating the scalp distribution of the ERP amplitude elicited by Black at the peaking time of P100 (More positive: Red, More negative: Blue). Oz is highlighted in the figure.
C. Source modeling results from sLORETA at the peaking time of P100 (all faces included in the analysis).
Note: Time waves in all figures were smoothed by averaging the amplitudes of 2 points before/after each particular time point (8 ms before and after).
