
Figure 6.
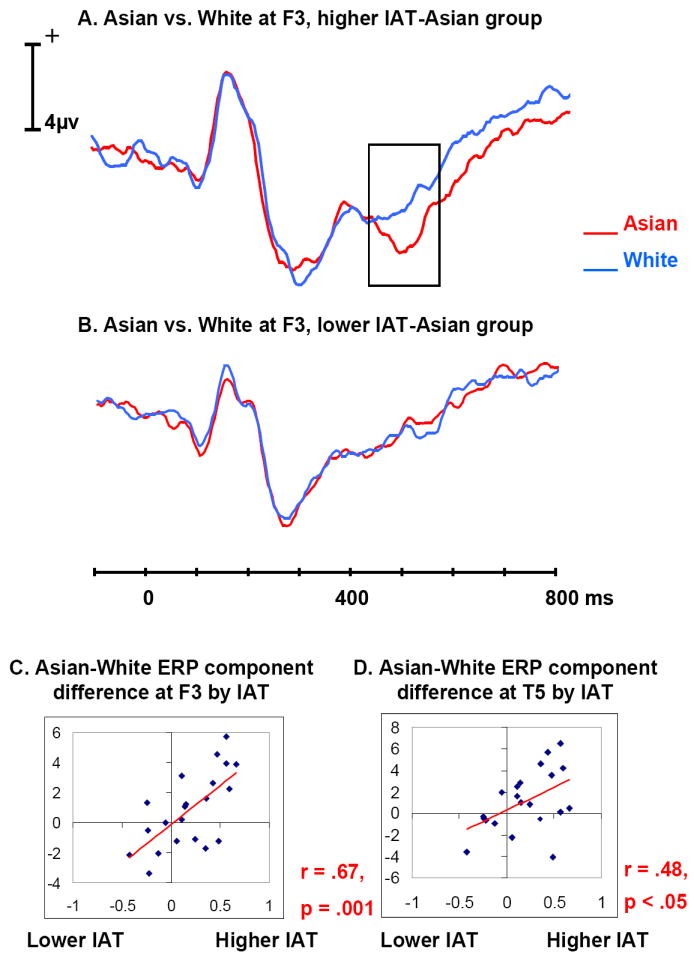
A. Average ERP time waves for Asian (red) and White (blue) at frontal electrode F3, in the group of participants with IAT-Asian scores higher than the median IAT-Asian. The difference between Figure A and B in ERP amplitude is highlighted in Figure A. Participants with more negative association to Asian faces appear to have larger negative ERP component at around 500 ms for Asian.
B. Average ERP time waves for Asian and White at frontal electrode F3, in the group of participants with IAT-Asian scores lower than the median IAT-Asian.
C. Scatter plot of the mean Asian-White amplitude difference at around 512 ms over frontal scalp by IAT-Asian for each participant, with a trend line added to show the correlation
D. Scatter plot of the mean Asian-White amplitude difference at around 496 ms over temporal scalp by IAT-Asian for each participant, with a trend line added to show the correlation.