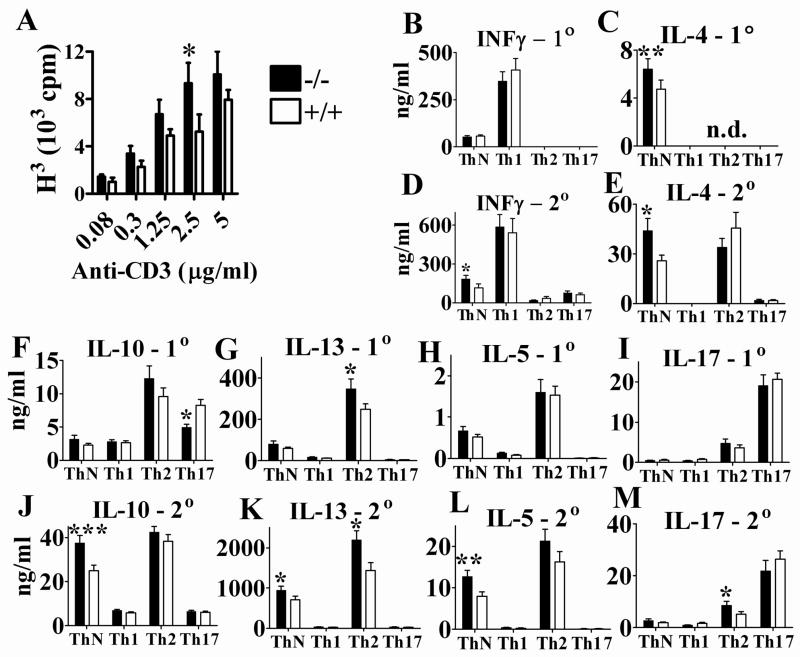
Fig. 3. Increased T cell proliferation and cytokine production in APRIL−/− mice.
A. T cell proliferation was measured by [3H] thymidine incorporation. Splenocytes were cultured at 1×10⁶ cells/ml and stimulated with 0–5μg/ml of anti-CD3 for 3 days. Representative data represent 7 pairs of mice from 5 independent experiments; * p=0.0401; n=7; paired t test. B – M. Cytokine production under ThN, Th1, Th2 and Th17 conditions upon primary (1°) and secondary (2°) stimulation, respectively. For details see Material and Methods. *, p<0.05; **, p<0.01; ***, p<0.001; n=10; paired t test. Data from 6 independent experiments (n=1–3 each) were combined. n.d.- Not done.

