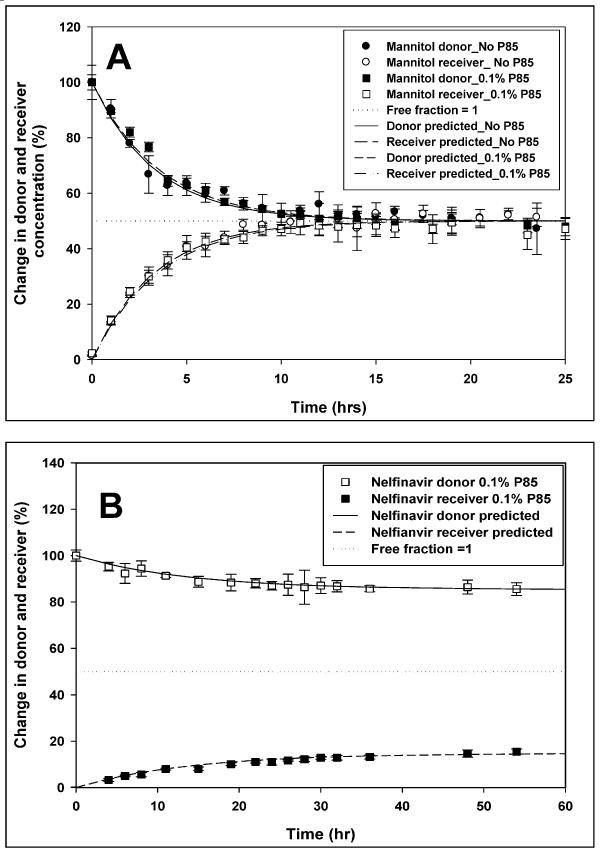
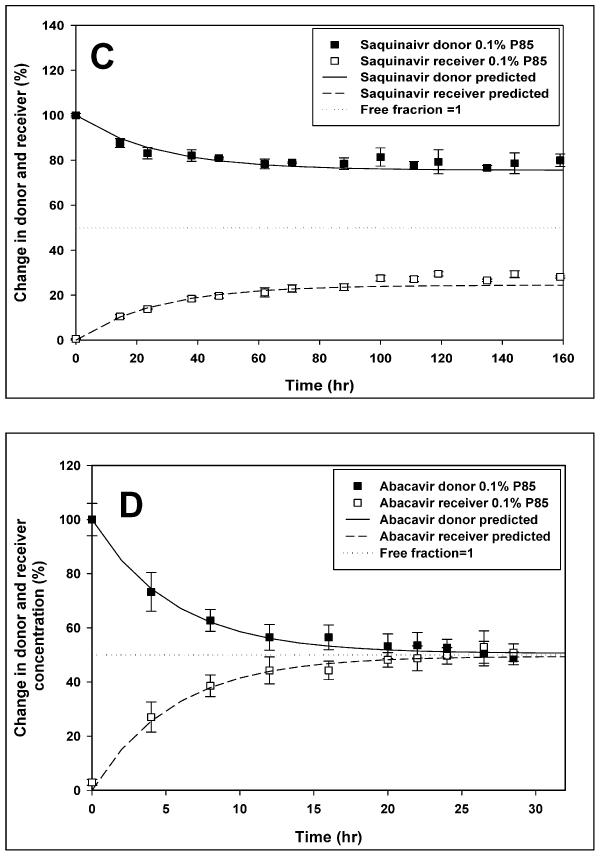
Figure 10.
Figure presents the effect of Pluronic P85 micellar concentration on equilibrium dialysis levels of various drugs. The change in donor and receiver concentrations for (A) Mannitol, (B) Abacavir, (C) Nelfinavir and (D) Saquinavir is depicted as a percentage of donor concentration at time zero with the horizontal dotted line representing a free fraction of 1. All plots represent the equilibrium dialysis of drug at micellar concentration of Pluronic P85 (0.1% w/w;∎ -donor,□ -receiver). Additionally, (A) represents the equilibrium dialysis of mannitol in the absence of Pluronic P85 (● -donor compartment,○ - receiver compartment); mean ± S.D., n=4. The solid line (—) represents the model predicted change in donor and the dashed line (-----) represents the model predicted change in receiver concentration.


