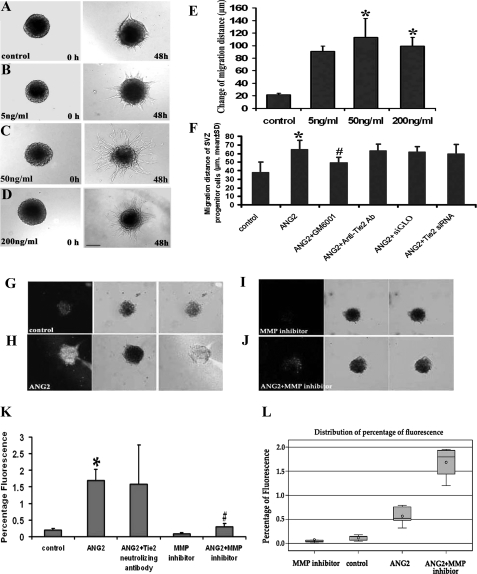
FIGURE 5.
The effect of rhANG2 on SVZ cell migration. Micrographs (A–D) show cell migration out of neurospheres seeded in Matrigel with various concentrations of rhANG2 during a 48-h period. Panel E shows quantitative data of migration distance 48 h after rhANG2 treatment. Blockage of Tie2 with a neutralized antibody against Tie2 or siRNA-Tie2 did not suppress ANG2-enhanced cell migration (F), whereas suppression of MMP with an MMP inhibitor GM6001 significantly reduced ANG2-enhanced migration (F). In situ gelatinase zymography of SVZ neurospheres (G–K) shows that incubation of SVZ neurospheres with rhANG2 significantly increased MMP activity (white in H and J) compared with the control group (white in G). However, incubation of neurospheres with rhANG2 in the presence of an MMP inhibitor GM6001 abolished ANG2-increased MMP activity (white in I and J). *, p < 0.05 versus control group; #, p < 0.05 versus ANG2 group. n = 12 per group. Bar = 50 μm. A box plot (L) displays summary statistics for the distribution of values for control (control), control + GM6001 (MMP inhibitor), rhANG2 (ANG2), and rhANG2 + GM6001 (ANG2+MMP inhibitor) groups. The outer bounds of the box represent the first and third quartiles. The line or circle inside the box represents the median or mean, respectively. The markers outside the box, referred to as outliers, represent data points that are outside of the 25th and 75th percentiles.

