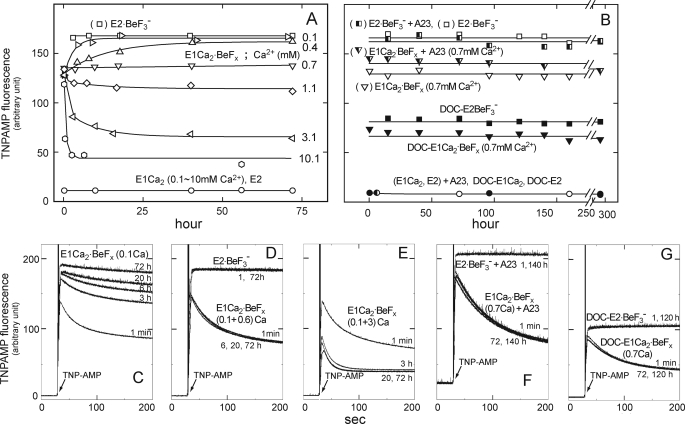
FIGURE 8.
Stability of E1Ca2·BeFx in various Ca2+ concentrations. A, E1Ca2·BeFx was first produced in SR vesicles in 0.1 mm Ca2+ and 15 mm MgCl2 with BeFx. Subsequently, Ca2+ was changed to 0.1 (unchanged), 0.4, 0.7, 1.1, 3.1, and 10.1 mm, and the incubations continued at 25 °C for 72 h. At the indicated periods, the superfluorescence with 4 μm TNP-AMP was examined at 25 °C, and the maximum levels obtained as described in the legend to Fig. 6 are shown. E2·BeF3− formed without Ca2+, E1Ca2 in 0.1–10 mm Ca2+, and E2 without Ca2+ were also incubated. B, in the presence of 0.7 mm Ca2+, E1Ca2 in SR vesicles was first incubated with and without 1.2 μm A23187 (A23), then BeFx was added (E1Ca2·BeFx). E1Ca2·BeFx (DOC-E1Ca2·BeFx) was also produced from E1Ca2 in 0.7 mm Ca2+ of the Ca2+-ATPase purified and delipidated from SR vesicles by deoxycholate (DOC) treatment (30). The incubation was continued for 12 days, otherwise as indicated in A. E2·BeF3− (E2·BeF3−, DOC-E2·BeF3−) without Ca2+ and E1Ca2 in 0.7 mm Ca2+ (E1Ca2, DOC-E1Ca2) and E2 without Ca2+ (E2, DOC-E2) were also incubated. C–G, the fluorescence traces upon TNP-AMP addition were shown for the representative samples with incubation periods and Ca2+ concentration (mm). Note that at 0.7 mm Ca2+, both with and without A23187, the development of the E1Ca2·BeFx characteristic transient superfluorescence remained perfectly the same for 12 days. By contrast, the transient superfluorescence was converted to the stable and higher superfluorescence characteristic of E2·BeF3− at 0.1 and 0.4 mm Ca2+, and it was markedly reduced by 3 and 10 mm Ca2+ due to decomposition to E1Ca2.

