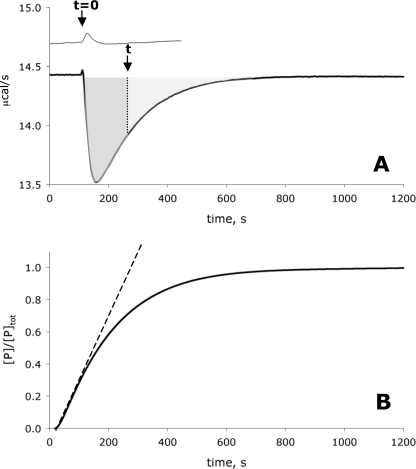
FIGURE 2.
Isothermal calorimetric measurement of the second order rate constant of the reaction catalyzed by HSK. 1.5 ml of 3 × 10⁻⁸ m enzyme (lower trace) or 0 m enzyme (upper trace) in HEPES buffer, pH 8.0, with 0.1 m homoserine was loaded into the reaction cell and equilibrated at 25 °C. The reaction was initiated by injecting 7.5 × 10⁻³ ml ATP (to a final concentration of 1 × 10⁻⁵ m ATP, a concentration far below the Km for ATP) in the same buffer at t = 0. Calorimeter output is displayed as a plot of microcalories per second (μcal/s) versus time. When HSK was present in the reaction cell (lower trace), heat was generated in proportion to substrate turnover. To calculate the percentage of reaction completed at any time t (arrow), the area in the well at time t (dark gray-shaded area) was divided by the total area in the well (gray-shaded area) (A). In this way a continuous reaction curve of product as a function of time was generated. The first 10% of that curve was used to calculate the second order rate constant kcat/Km (B).

