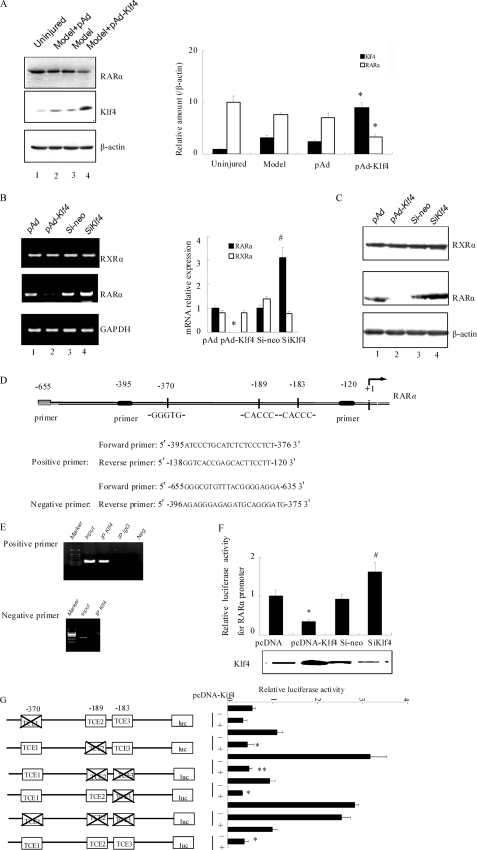
FIGURE 4.
Klf4 down-regulates the expression and activity of RARα. A, immediately following balloon injury, vehicle, pAd, or pAd-Klf4 was infused into the segment of the common carotid artery as described under “Experimental Procedures.” Three days later, the arteries were harvested, and Western blot analysis was performed with antibodies against RARα, Klf4, and β-actin as a loading control. Blots from a representative experiment are shown on the left. Right panel, densitometry analysis was carried out and normalized to β-actin. The bars represent the means ± S.E. of three independent experiments. *, p < 0.05 versus pAd group. B, VSMCs were infected with pAd, pAd-Klf4, control siRNA (si-neo), or siKlf4 for 2 days before lysis and processing for semi-quantitative reverse transcription-PCR. Left panel, result from a representative experiment. Right panel, densitometry analysis for RXRα (open bars) and RARα (filled bars) mRNA was carried out and normalized to glyceraldehyde-3-phosphate dehydrogenase mRNA levels. The bars represent the means ± S.E. of three independent experiments. *, p < 0.05 versus pAd group; #, p < 0.05 versus si-neo group. C, VSMCs were infected as indicated in Fig. 4B and harvested. Western blot analysis was performed with antibodies against RXRα, RARα, and β-actin as a loading control. D, primers used for amplification of the rat RARα promoter for chromatin immunoprecipitation assays. E, chromatin immunoprecipitation assays using anti-Klf4 immunoprecipitates were performed with untreated VSMCs. Nonimmune IgG was used as negative control for immunoprecipitation, DNA was replaced with water as the PCR negative control, and Input corresponds to extracted DNA from the sample prior to immunoprecipitation. The results are from representative experiments that have been repeated three times with similar results. F, A293 cells were transiently cotransfected with the 5′ regulatory region of RARα (−395 to −120 bp) fused in-frame in the pGL3-Basic luciferase reporter vector plasmid together with either pcDNA empty vector, pcDNA-Klf4, control si-neo, or siKlf4. Forty-eight hours later, the cells were harvested, and the activity of firefly luciferase was measured and normalized to that of Renilla luciferase. The bars represent the means ± S.E. from three independent experiments. *, p < 0.05 versus pcDNA group; #, p < 0.05 versus si-neo group. G, A293 cells were cotransfected with the RARα promoter-luciferase constructs indicated on the left of the figure with either pcDNA or pcDNA-Klf4. Twenty-four hours later, luciferase activity was measured as indicated above. The values represent the means ± S.E. of three independent experiments. *, p < 0.05 versus pcDNA group; **, p < 0.01 versus pcDNA group.

