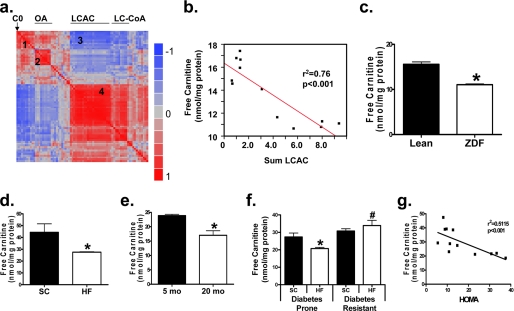
FIGURE 1.
Dimunition of free carnitine levels in insulin-resistant skeletal muscle. A heat map representation (a) of the pairwise correlation matrix was generated using metabolic profiles of gastrocnemius muscles from lean and obese Zucker diabetic fatty (ZDF) rats as described in a previous study (5). Each square represents the Pearson correlation coefficient between the metabolite of the column with that of the row, according to the color scale. Metabolite order was determined by unsupervised clustering of the correlations. Several organic acids (OA) and long chain acylcarnitines (LCAC) clustered together (clusters 2 and 4, respectively). Free carnitine (C0) correlated positively with several short chain acylcarnitines and amino acids (cluster 1) and negatively with several LCAC and long chain CoAs (LC-CoA (cluster 3)). The strong negative relationship between free carnitine and total LCAC is shown in panel b. Tandem MS/MS was used to measure free carnitine content of mixed gastrocnemius muscle specimens obtained from lean and ZDF rats (c), animals fed a standard chow (SC) or high fat (HF) diet for 3 months (d), young (5 month), and aged (20 month) rats fed an SC diet (e), and rats artificially selected for running capacity that exhibit disparate susceptibility to HF diet-induced insulin resistance (f and g). Tissues were harvested 4 h after food withdrawal (a–e), or after an overnight fast (f and g). Data represent means ± S.E. from 5–8 animals per group. Results were analyzed by one-way (c–e) or two-way (f) analysis of variance using Tukey's post hoc test to determine differences between groups. *, p < 0.05 versus control group; #, p < 0.05 diabetes prone versus diabetes resistant rats.

