FIGURE 2.
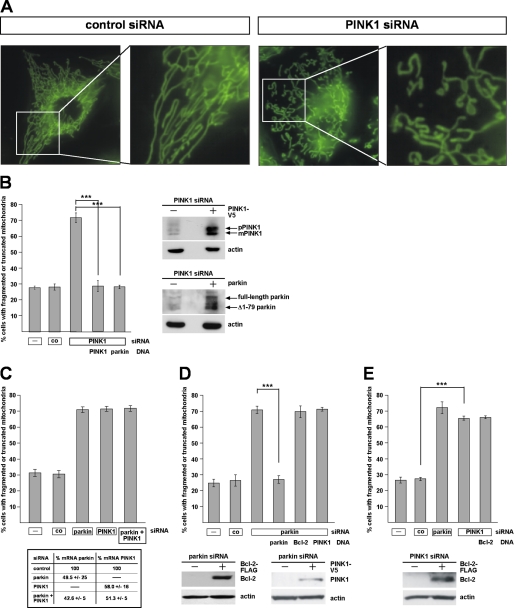
PINK1-deficient SH-SY5Y cells show alterations in mitochondrial morphology similar to parkin-deficient cells. A, SH-SY5Y cells transfected with control siRNA or siRNA targeting PINK1 were stained with the fluorescent dye DiOC6(3) to visualize mitochondria and analyzed by fluorescence microscopy as described in Fig. 1. B, down-regulation of PINK1 by RNAi leads to an increase in mitochondrial fragmentation, which can be rescued by parkin. SH-SY5Y cells were transfected with PINK1-specific siRNA and either siRNA-resistant PINK1 or wild type parkin. The cells were analyzed by fluorescence microscopy as described in Fig. 1. Right panel, expression of PINK1 and parkin was analyzed by Western blotting using a monoclonal anti-V5 antibody or the anti-parkin anti-serum hP1. pPINK1, precursor form; mPINK1, mature form. C, simultaneous down-regulation of parkin and PINK1 does not increase mitochondrial fragmentation over the single parkin or PINK1 knockdown. SH-SY5Y cells were transfected with parkin-specific siRNA and/or PINK1-specific siRNA, and the cells were analyzed by fluorescence microscopy as described above. Lower panel, efficiency of PINK1 and/or parkin down-regulation was determined by quantitative RT-PCR as described under “Experimental Procedures.” D and E, anti-apoptotic Bcl-2 has no effect on the mitochondrial morphology in parkin or PINK1 knockdown cells. PINK1 cannot rescue the parkin knockdown phenotype (D). SH-SY5Y cells were transfected with parkin-specific siRNA (D) or PINK1-specific siRNA (E) and a Bcl-2 or PINK1 expression plasmid. The cells were analyzed as described in Fig. 1. Lower panels, expression of Bcl-2 and PINK1 was analyzed by Western blotting. ***, p ≤ 0.001.

