FIGURE 5.
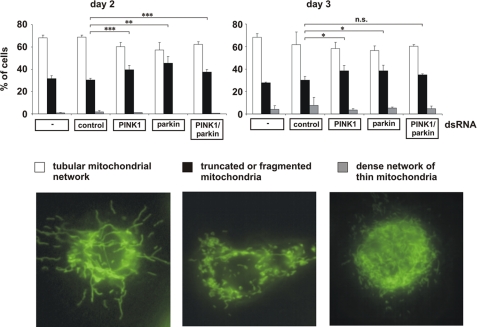
In Drosophila S2 cells, mitochondrial fragmentation is an early phenotype of parkin and/or PINK1 loss of function. S2 cells grown on glass coverslips were treated with control dsRNA and parkin- and/or PINK1-specific dsRNA. 48 h (day 2), 60 h (day 3), and 72 h (day 4, data not shown) after dsRNA treatment, S2 cells were stained with the fluorescent dye DiOC6(3) to visualize mitochondria and analyzed by fluorescence microscopy. Cells were categorized in three classes according to their mitochondrial morphology. For quantification, the mitochondrial morphology of at least 300 cells per plate was determined in a blinded manner. Quantifications were based on triplicates of at least two independent experiments. Shown is the percentage of cells with a tubular mitochondrial network (white columns), fragmented or truncated mitochondria (black columns), or a dense network of thin mitochondria (gray columns). Lower panel, fluorescence microscopy images to illustrate the different categories of mitochondrial morphologies. Efficiencies of parkin and PINK1 down-regulation is shown in Fig. 6B. **, p ≤ 0.01; ***, p ≤ 0.001.

