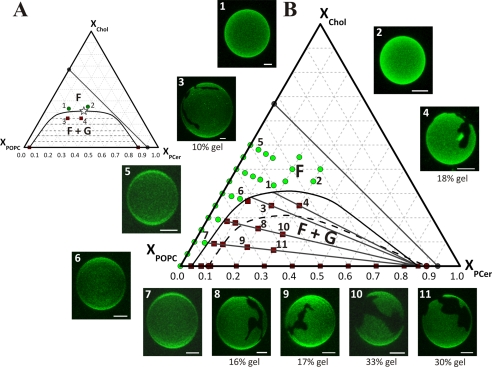
FIGURE 4.
Ternary POPC/Chol/PCer phase diagram. A, schematic representation of the usual configuration of the solid-liquid phase separation region in high Tm PC/low Tm PC/Chol ternary mixtures. B, ternary phase diagram POPC/Chol/PCer with the experimentally determined solid-liquid phase separation region and tie lines. The symbols are experimental data points taken from Figs. 1 and 2 and supplemental Fig. S4 and from confocal microscopy images present in B, for which only liquid phase (green circles in the F region) or solid and liquid phases (red squares in the F + G region) were observed. The straight dark gray line shows the bilayer solubility limit of Chol plus Cer (15, 25). Three-dimensional projection images obtained from fluorescence confocal microscopy sections of GUV labeled with Rho-DOPE (0.2 mol %) at 24 °C for the experimental points 1–11 are shown (scale bar, 5 μm). A, Chol solubility is similar in the fluid and in the gel phase. B, Chol solubility is much lower in the gel phase than in the fluid phase. The gel fraction formed in mixtures 3, 4, and 8–11 is indicated below each GUV image (average of more than 10 GUVs from three independent samples). It is not possible to form stable GUVs for very high Cer concentrations, and t-PnA fluorescence is no longer sensitive to the formation of more gel after a considerable amount of gel is present. However, it is not necessary to explore those compositions to determine the whole solid-liquid coexistence region (17, 34). In phase diagrams like the one depicted in A, there is a critical point (indicated as a star). However, there is no evidence for the presence of a critical point in the diagram depicted in B. The black dashed line indicates the gel-fluid phase coexistence region predicted for the mixture DOPC/Chol/PCer based on experimental data for that mixture and the comparison with the POPC/Chol/PCer mixture.

