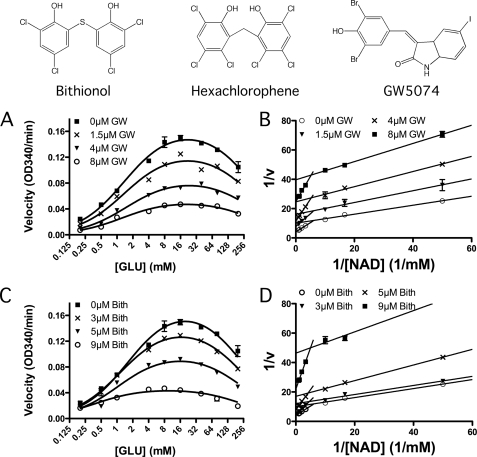
FIGURE 3.
Steady-state kinetic analysis of bovine GDH inhibition by these compounds. Shown at the top are the chemical structures of the three compounds used in these structural studies and previously identified in high throughput screens (32). The effects of hexachlorophene (HCP) on the oxidative deamination reaction has already been demonstrated (32). Shown in A and C are the steady-state velocities at varied glutamate and bithionol (Bith) or GW5074 concentrations. The marked downward trend in the curve at concentrations above 16 mm glutamate is due to substrate inhibition, and therefore the data were analyzed using the modified Monod equation (Equation 1) and summarized in Table 1. Shown in B and D are the Lineweaver-Burk plots of the oxidative deamination reaction at varying NAD+ and drug concentrations. Here, there is a marked break from the expected linearity at ∼0.1 mm NAD+ due to negative cooperativity (40). The Vmax and Km were estimated from the data at high NAD+ concentrations and summarized in Table 1.

