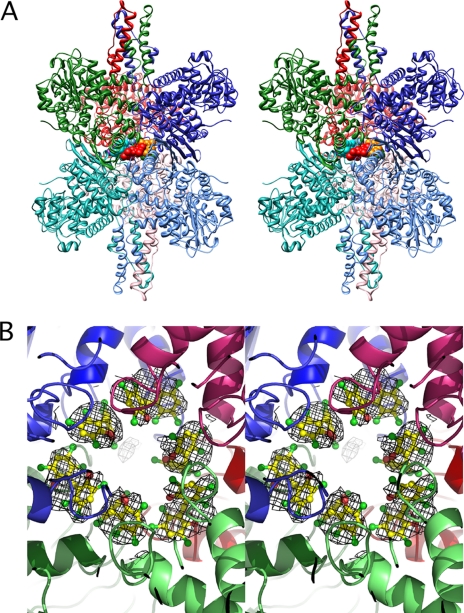
FIGURE 4.
The structure of HCP bound to the bovine GDH·NADP+·GLU·GTP complex. A, stereo ribbon diagram of bovine GDH with the subunits colored in a manner similar to Fig. 1. For clarity, the other bound ligands (GTP, NADPH, and glutamate) are not shown in the diagram. In the central core, each of the six HCP molecules is represented by different colored spheres. B, stereo view is of the central core region looking down from the top of the hexamer, through the 3-fold axis running through the antenna. The six copies of HCP are represented by ball-and-stick models, and their corresponding electron densities are shown at a contour level of 1σ.

