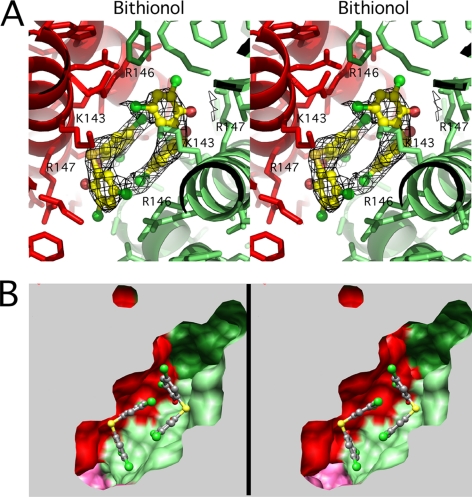
FIGURE 6.
Electron density and binding environment of the bound bithionol. The view and coloring are the same as the top of Fig. 3, looking toward the core of the enzyme along one of the 2-fold axes and perpendicular to the 3-fold axis. A, a stereo image of the bithionol·GDH complex with the drug molecules represented by ball-and-stick models and contact residues are noted. B, a stereo view of the atomic surface of the binding site, colored according as per all of the other figures. Note that this cavity is visible from the exterior of the hexamer.

