FIGURE 1.
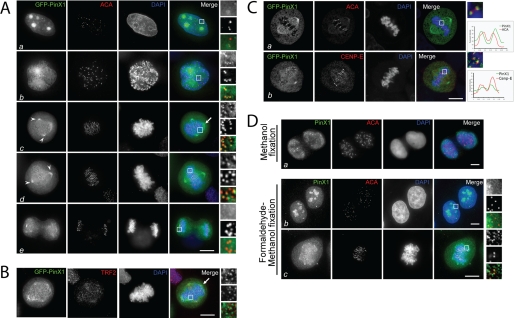
PinX1 localizes to chromosome periphery and outer plate of kinetochore in mitosis. A, subcellular distribution of GFP-PinX1 in HeLa cells. This montage represents optical images collected from PinX1-transfected HeLa cells triply stained for GFP-PinX1 (green), ACA (red), and DAPI (blue). Merged and enlarged images are also shown on the right. In interphase (panel a), it is readily apparent that PinX1 is concentrated in the nucleolus, appearing as four bright spots. No co-distribution of PinX1 with ACA was observed. A merged image shows the PinX1 staining is concentrated in the nucleolus. In prophase (panel b), the centrosomal and kinetochore labeling of PinX1 becomes apparent, which is clearly seen in the enlargement as PinX1 labeling is superimposed onto that of ACA. In prometaphase (panel c), PinX1 labeling remains at the kinetochore in addition to spindle poles (arrowheads) and chromosome periphery (arrow). In metaphase (panel d), PinX1 labeling begins dissociating from the kinetochore, which is apparent as less PinX1 is superimposed onto that of ACA (boxed area). The association of PinX1 to the spindle poles remains unchanged. In anaphase (panel e), PinX1 labeling on the mitotic spindle is decreased. Bar, 10 μm. B, this montage represents optical images collected from PinX1-transfected HeLa cells triply stained for GFP-PinX1 (green), TRF2 (red), and DAPI (blue). The arrow indicates the remnant chromosome peripheral localization of GFP-PinX1 in these pre-extracted cells. Bar, 10 μm. C, this montage represents optical images collected from PinX1-transfected HeLa cells triply stained for GFP-PinX1 (green), CENP-E/ACA (red), and DAPI (blue). GFP-PinX1-expressing metaphase cells were stained with ACA or anti-CENP-E antibody and examined by confocal microscopy to specify the kinetochore localization of PinX1. Linear scans of fluorescent intensities across kinetochore pairs are shown. GFP-PinX1 is shown in green, ACA or CENP-E in red, and DNA in blue. Bar, 10 μm. D, comparison of different fixatives for imaging endogenous PinX1 protein. HeLa cells were fixed either in cold methanol only or first in formaldehyde and then in cold methanol. These cells were subsequently stained with anti-PinX1 mouse serum. The enlargements show kinetochore localization of endogenous PinX1 in mitosis. PinX1 is presented in green, ACA in red, and DNA in blue. Bars, 10 μm.

