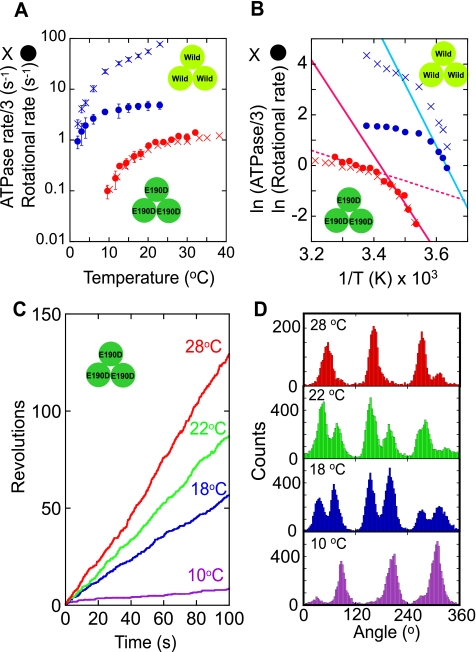
FIGURE 1.
A, temperature dependence of the rotational rate (circles) and ATP hydrolysis rate in a bulk solution (crosses) of F1(βE190D) (red) and wild-type F1 (blue) (21) at saturating ATP concentration (2 mm for F1(βE190D) and 1 mm for wild-type F1). The ATP hydrolysis rate was divided by 3 for comparison with the rotational rate. B, Arrhenius plots of traces in A. The rate-limiting reactions of the rotational rates at low temperature (below 17 °C for the mutant F1 and below 4 °C for wild-type F1) were analyzed to determine the activation energy (Table 1) using linear regression (solid lines). The rotational rates of F1(βE190D) above 20 °C were also fitted by linear regression (dotted red line). C, time courses of rotation of F1(βE190D) at various temperatures. D, histograms of the angle from traces in C.

